Fig. 4
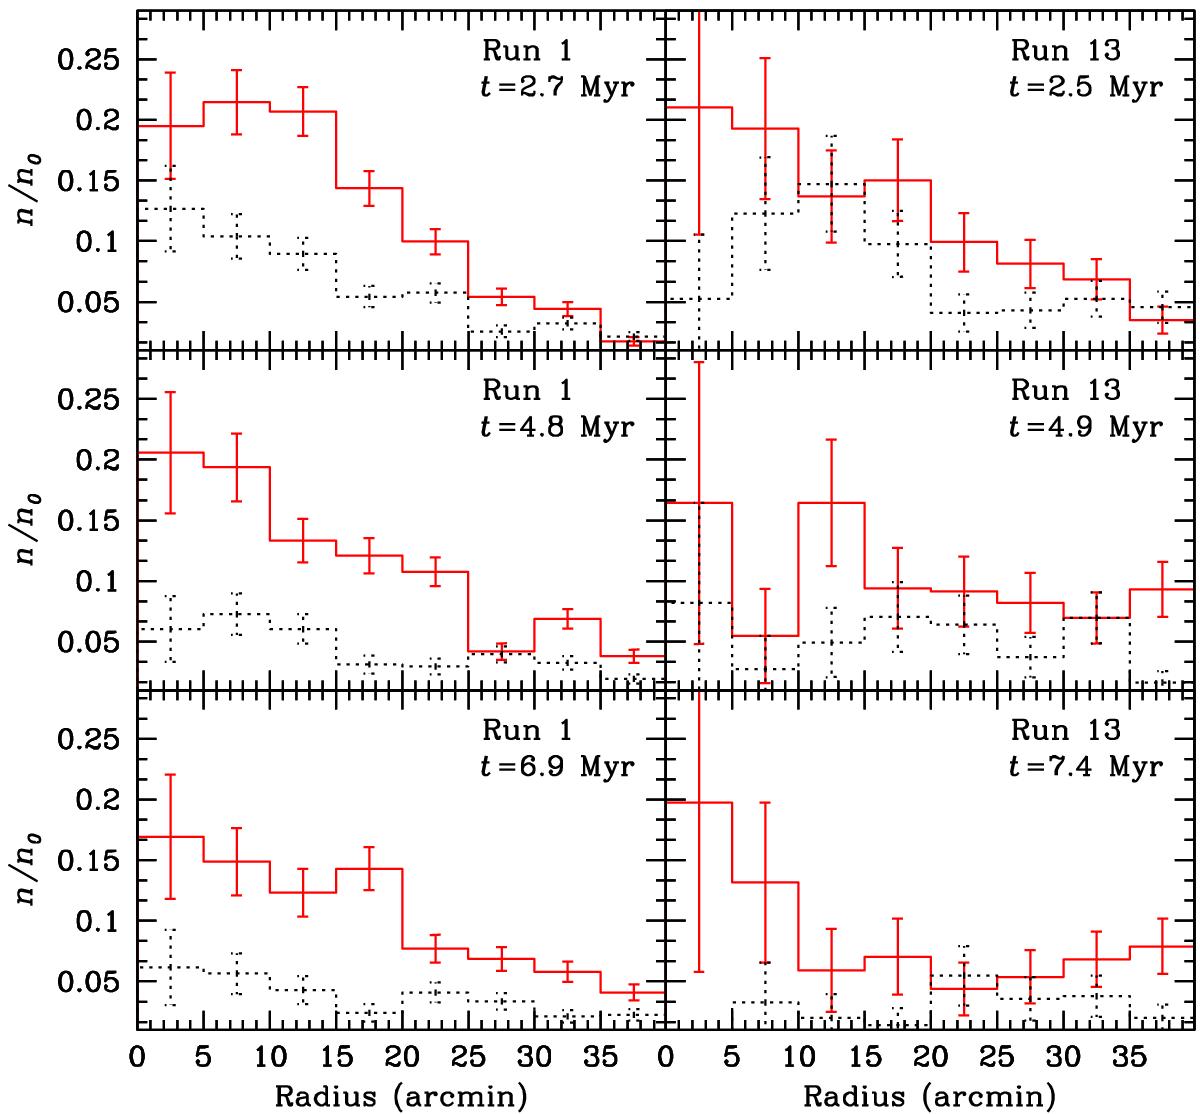
Normalized radial stellar density in run 1 (left-hand panels) and in run 13 (right-hand panels) at different times. The simulated cluster is assumed to be at a distance of 350 pc. Solid red line: pop. A; dotted black line: pop. B. The density n is calculated as stars per arcmin2, within concentric annuli. The normalization n0 was chosen so that the total area below the histogram of pop. A is one. The error bars account for Poisson uncertainties.
Current usage metrics show cumulative count of Article Views (full-text article views including HTML views, PDF and ePub downloads, according to the available data) and Abstracts Views on Vision4Press platform.
Data correspond to usage on the plateform after 2015. The current usage metrics is available 48-96 hours after online publication and is updated daily on week days.
Initial download of the metrics may take a while.