Fig. 2
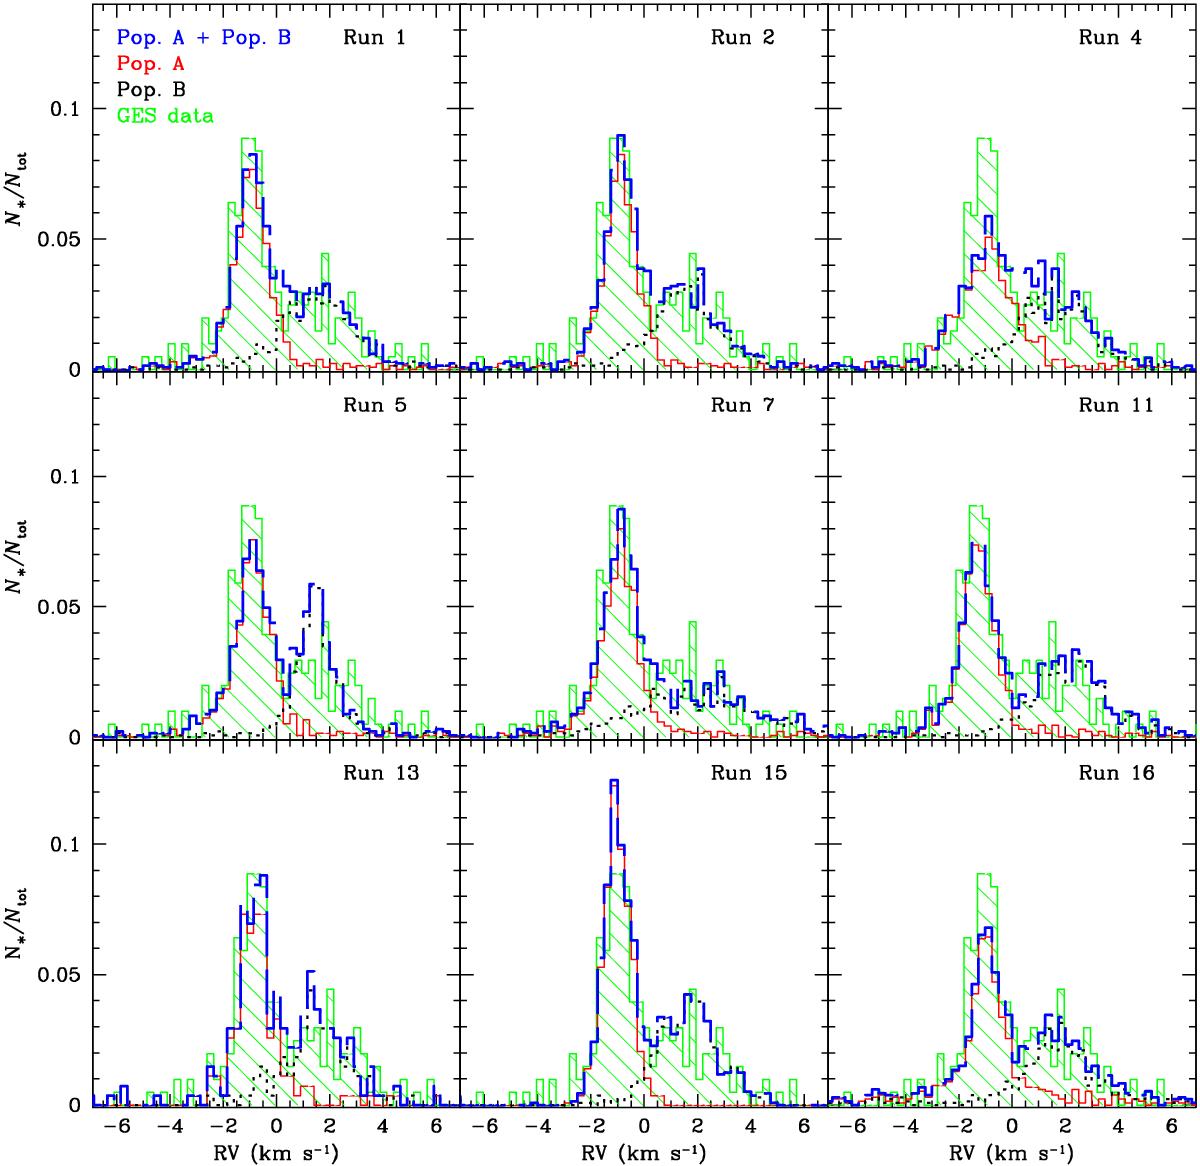
From top to bottom and from left to right: distribution of the RVs of stars in run 1, 2, 4, 5, 7, 11, 13, 15 and 16 at t = 4.8 Myr (see Table 1). The simulated RVs include randomly generated observational uncertainties. Solid red line: pop. A (cluster 1); dotted black line: pop. B (cluster 2); dashed blue line: sum of the two components. We define RV as the velocity along the y axis (i.e. we assume that the line-of-sight coincides with the direction that maximizes the velocity shift between the two clusters). Green shaded histogram: observed RV distribution (the same as in Fig. 6 of Jeffries et al. 2014).
Current usage metrics show cumulative count of Article Views (full-text article views including HTML views, PDF and ePub downloads, according to the available data) and Abstracts Views on Vision4Press platform.
Data correspond to usage on the plateform after 2015. The current usage metrics is available 48-96 hours after online publication and is updated daily on week days.
Initial download of the metrics may take a while.