Free Access
Fig. 3
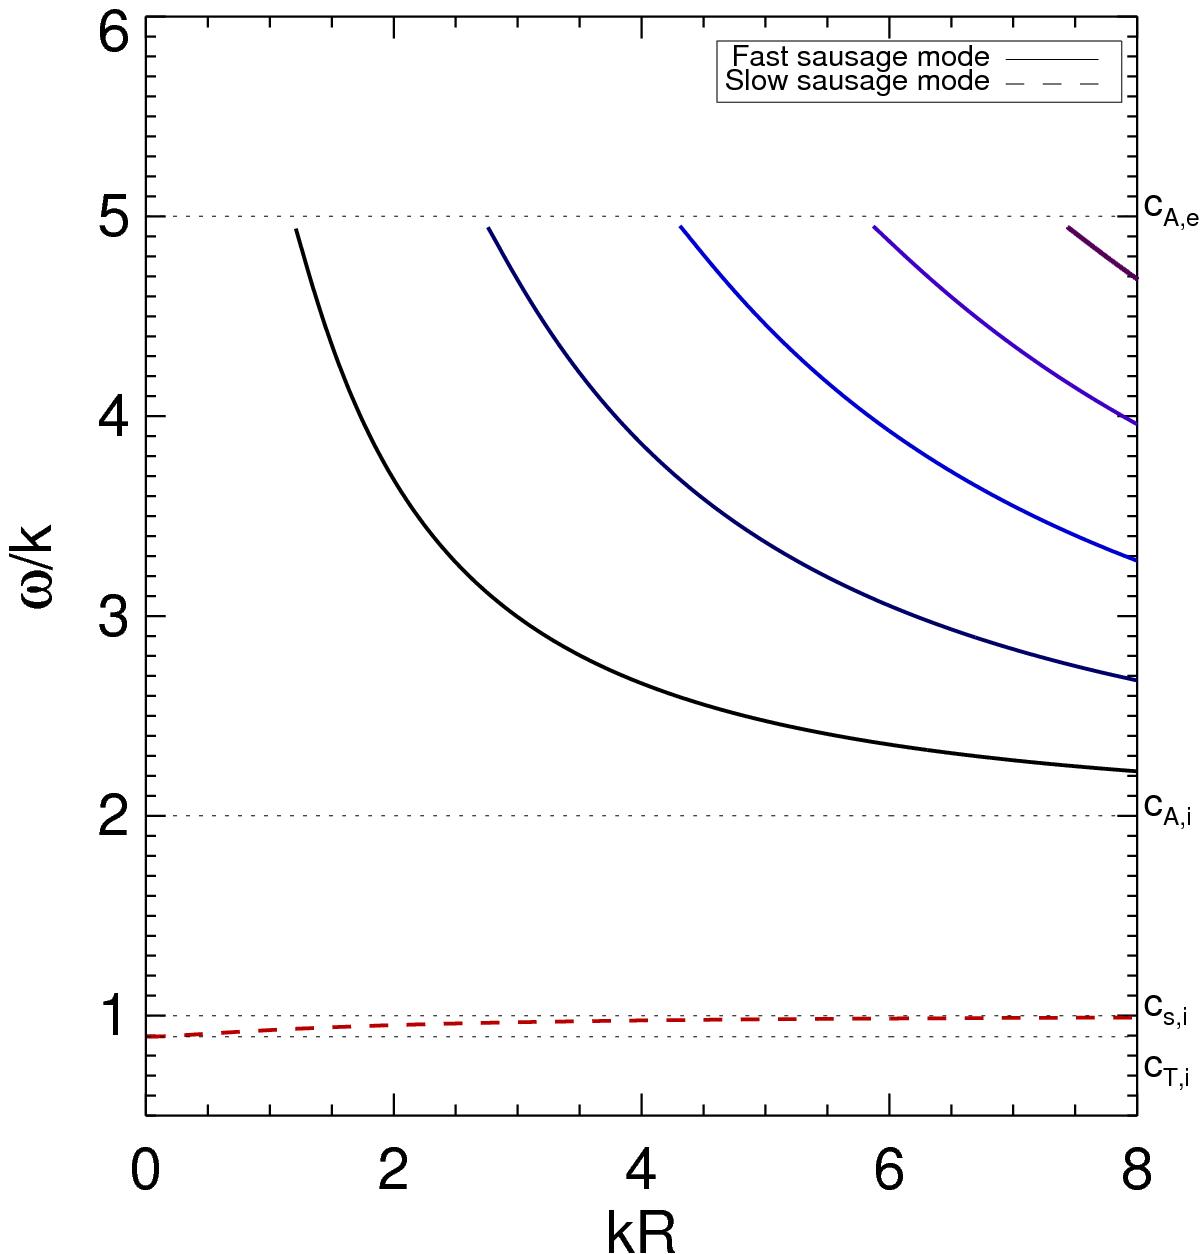
Phase speed diagram of wave modes under coronal conditions. We have taken cA,i = 2cs,i, cA,e = 5cs,i, and cs,e = 0.5cs,i. All modes are body modes. For the slow modes we only plotted one mode, for the fast modes we plotted five modes, while for both there are an infinite number of radial overtones.
Current usage metrics show cumulative count of Article Views (full-text article views including HTML views, PDF and ePub downloads, according to the available data) and Abstracts Views on Vision4Press platform.
Data correspond to usage on the plateform after 2015. The current usage metrics is available 48-96 hours after online publication and is updated daily on week days.
Initial download of the metrics may take a while.