Fig. 2
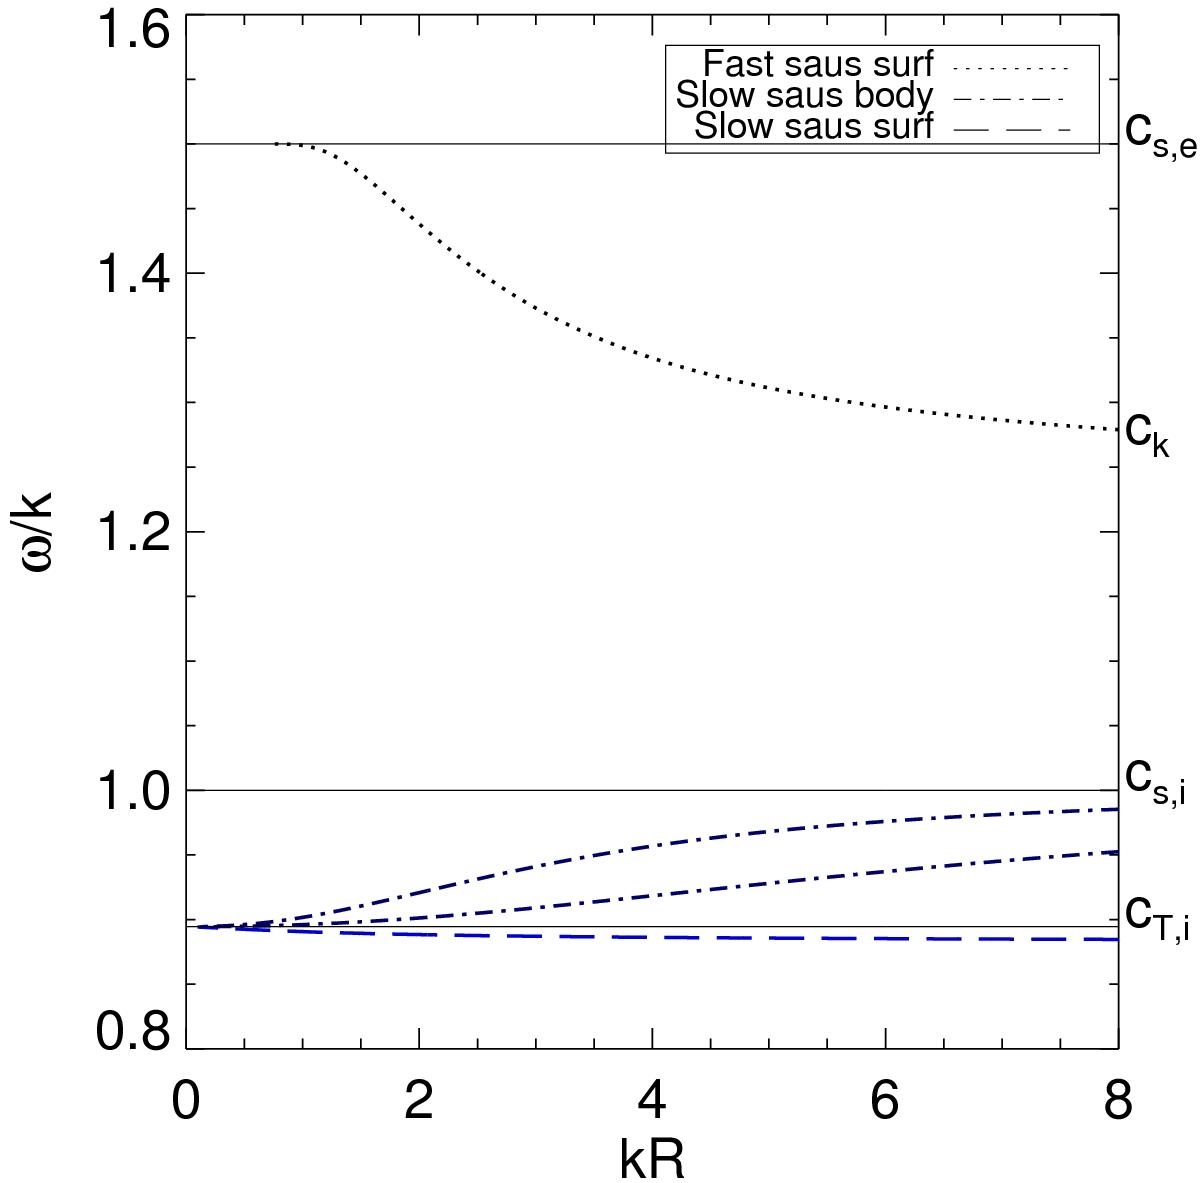
Phase speed diagram of wave modes under photospheric conditions. We have taken cA,i = 2cs,i, cA,e = 0.5cs,i, and cs,e = 1.5cs,i. The Alfvén speeds are not indicated in the graph because no modes with real frequencies appear in that vicinity. The modes with phase speeds between cT,i and cs,i are body modes and the other modes are surface modes. We note that we only plotted two body modes, while there are infinitely many radial overtones.
Current usage metrics show cumulative count of Article Views (full-text article views including HTML views, PDF and ePub downloads, according to the available data) and Abstracts Views on Vision4Press platform.
Data correspond to usage on the plateform after 2015. The current usage metrics is available 48-96 hours after online publication and is updated daily on week days.
Initial download of the metrics may take a while.