Fig. 6
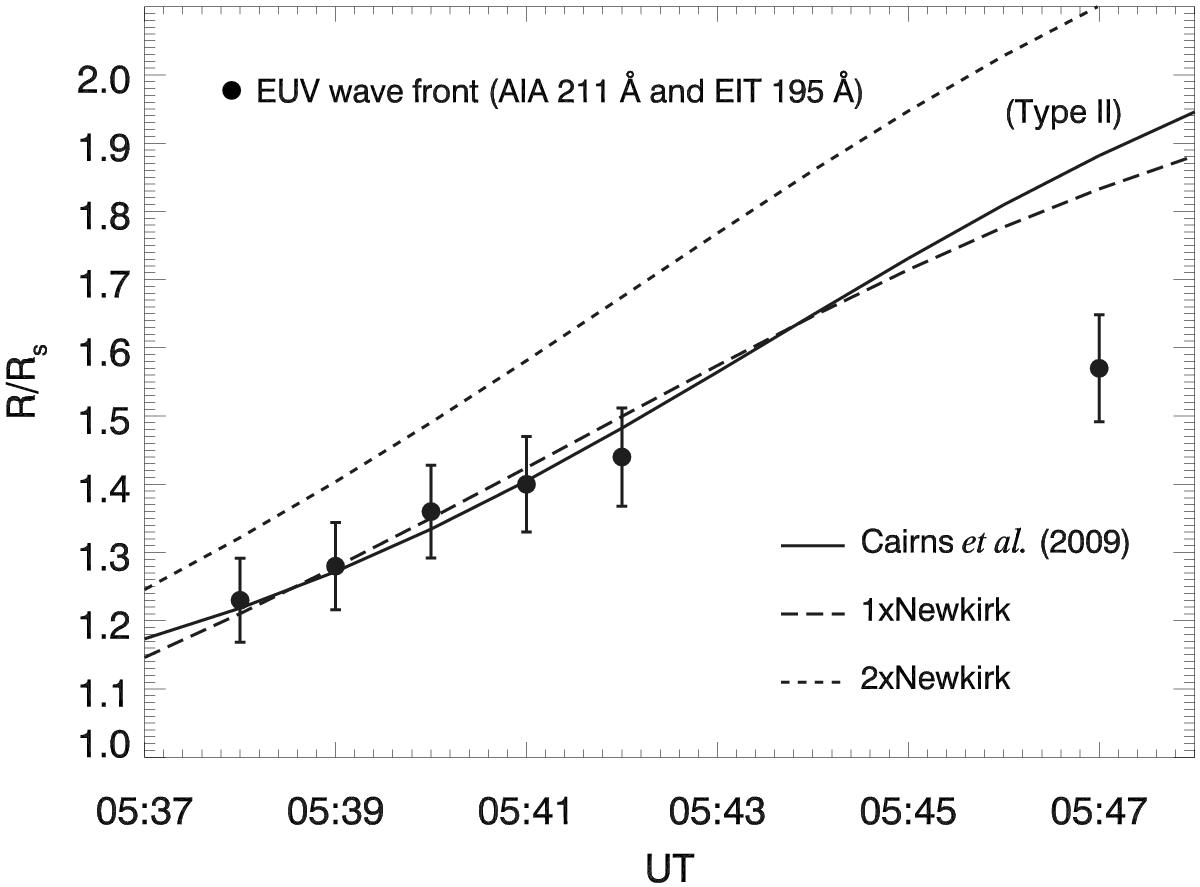
Comparison of the type II heights, obtained with the density models of 1–2×Newkirk (dashed lines) and Cairns et al. (2009; solid line), applied to the frequencies provided by the exponential fit on the intensity maxima of the lower-frequency branch, with the heights of the EUV wave fronts (five data points from SDO/AIA 211 Å, limited by the field of view (FOV) of the instrument, and one data point from SoHO/EIT 195 Å, at the end of the type II emission), for event 1. The models of 1×Newkirk and of Cairns et al. (2009) provided similar results for event 1.
Current usage metrics show cumulative count of Article Views (full-text article views including HTML views, PDF and ePub downloads, according to the available data) and Abstracts Views on Vision4Press platform.
Data correspond to usage on the plateform after 2015. The current usage metrics is available 48-96 hours after online publication and is updated daily on week days.
Initial download of the metrics may take a while.