Fig. 8
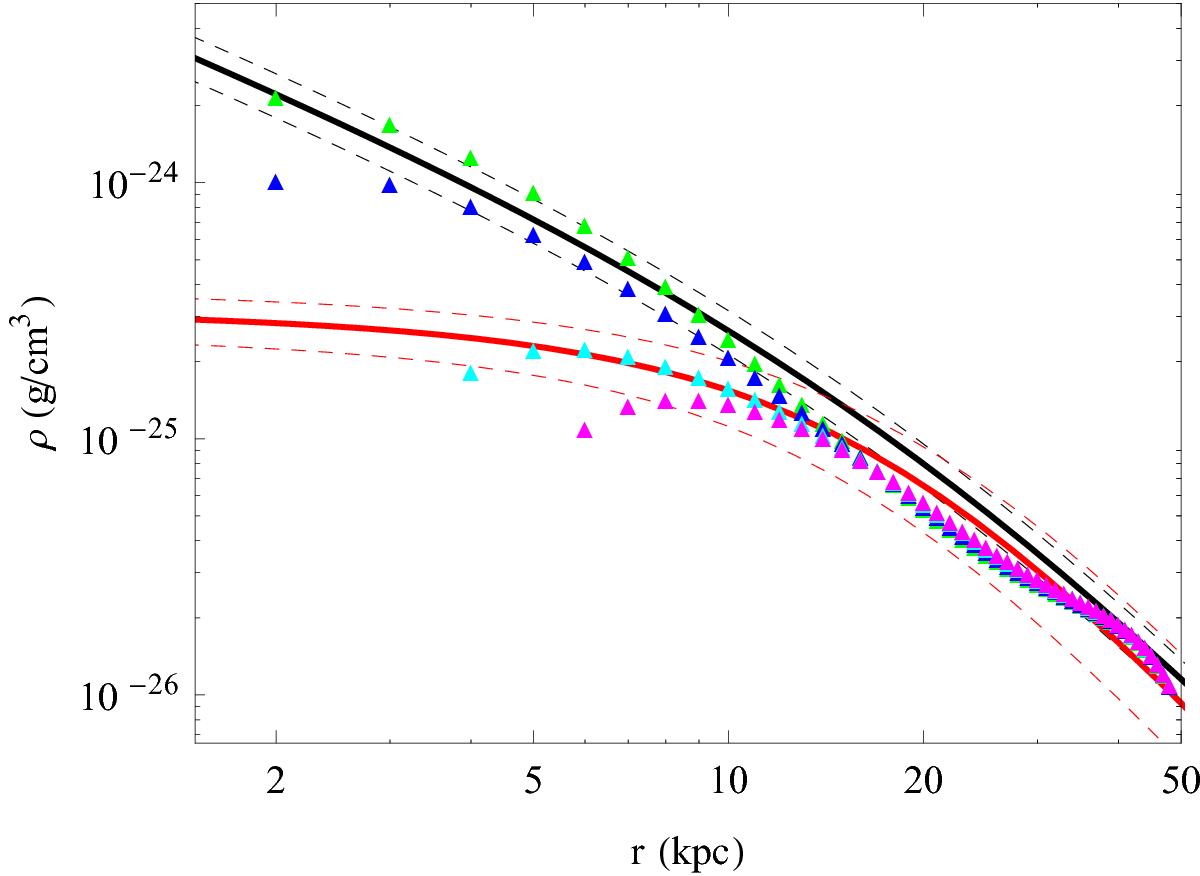
DM density profiles for different disk mass values MD = n × 1010M⊙ and n = 2,3,4.4,5 from the highest to the lowest curve (green, blue, azure and magenta triangles). The black solid line shows the NFW density profile with Mvir = 8.9 × 10¹¹M⊙ corresponding to the best fit values found in the previous section. Two black dashed lines show the NFW density profiles taking 1σ uncertainties in Mvir and 10 percent of uncertainties in c into account. The URC halo is shown as red solid line. Two red dashed lines show the URC density profiles obtained by taking 1σ uncertainties in ρ0,rc into account.
Current usage metrics show cumulative count of Article Views (full-text article views including HTML views, PDF and ePub downloads, according to the available data) and Abstracts Views on Vision4Press platform.
Data correspond to usage on the plateform after 2015. The current usage metrics is available 48-96 hours after online publication and is updated daily on week days.
Initial download of the metrics may take a while.