Free Access
Fig. 1
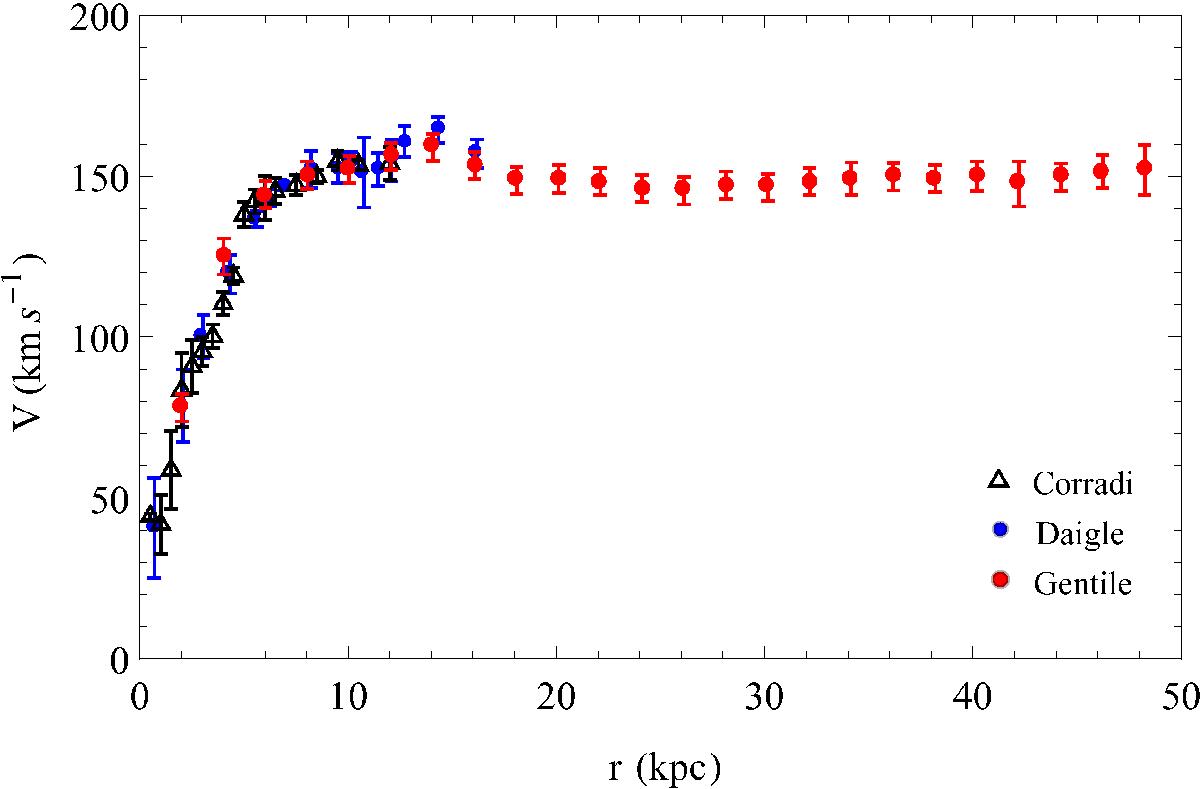
Comparison between Hα and HI RCs black open triangles with error bars from Corradi et al. (1991), blue circles with error bars are from Daigle et al. (2006), and red circles with error bars are from Gentile et al. (2013).
Current usage metrics show cumulative count of Article Views (full-text article views including HTML views, PDF and ePub downloads, according to the available data) and Abstracts Views on Vision4Press platform.
Data correspond to usage on the plateform after 2015. The current usage metrics is available 48-96 hours after online publication and is updated daily on week days.
Initial download of the metrics may take a while.