Fig. 4
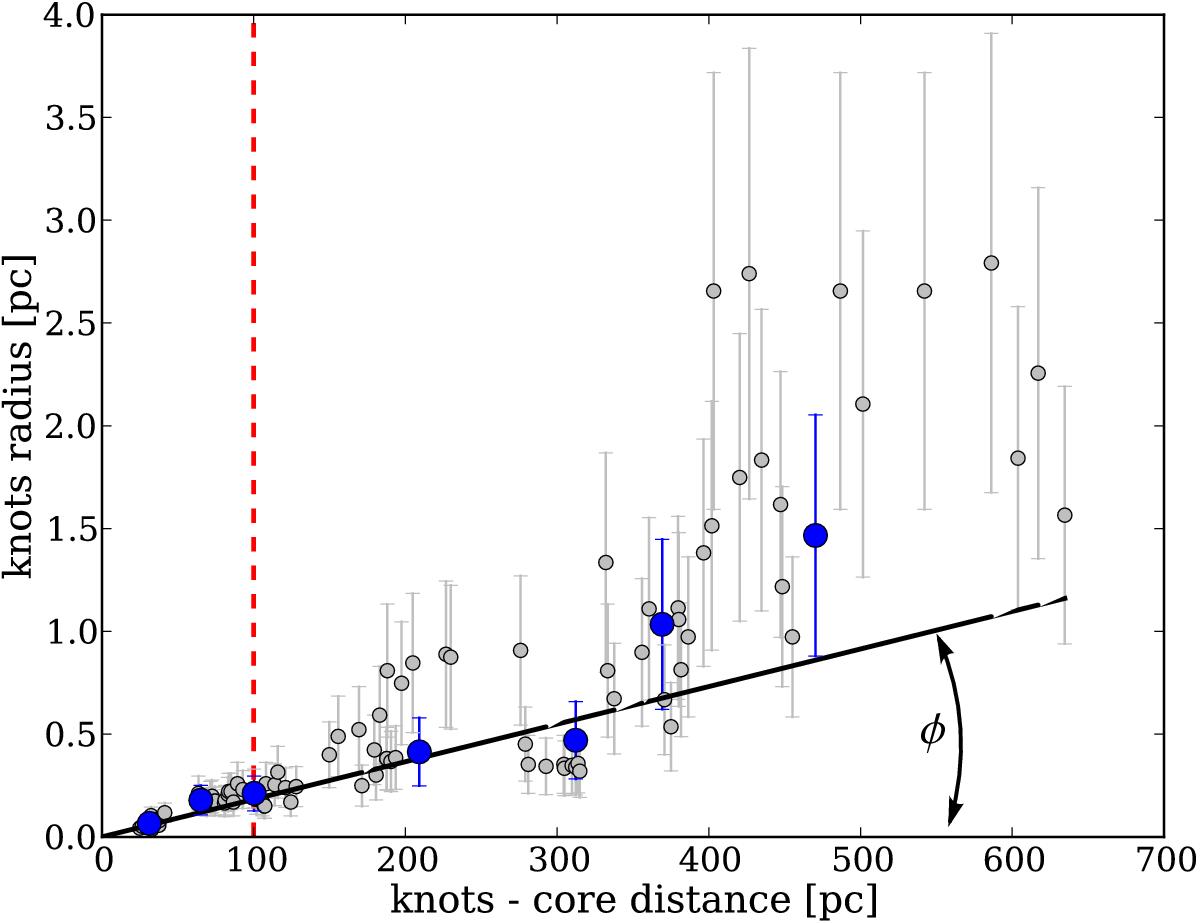
Core distances and radius of radio knots observed by MOJAVE for an angle with the line of sight θ of 1.38°. Grey dots show the referenced knots from August 18, 1997 to March 5, 2011. Blue dots show radio knots of December 26, 2009. The black line is a linear regression that we use to characterize the knots expansion angle φ. The red dashed line at 100 pc marks the length of the simulated jet.
Current usage metrics show cumulative count of Article Views (full-text article views including HTML views, PDF and ePub downloads, according to the available data) and Abstracts Views on Vision4Press platform.
Data correspond to usage on the plateform after 2015. The current usage metrics is available 48-96 hours after online publication and is updated daily on week days.
Initial download of the metrics may take a while.