Fig. 1
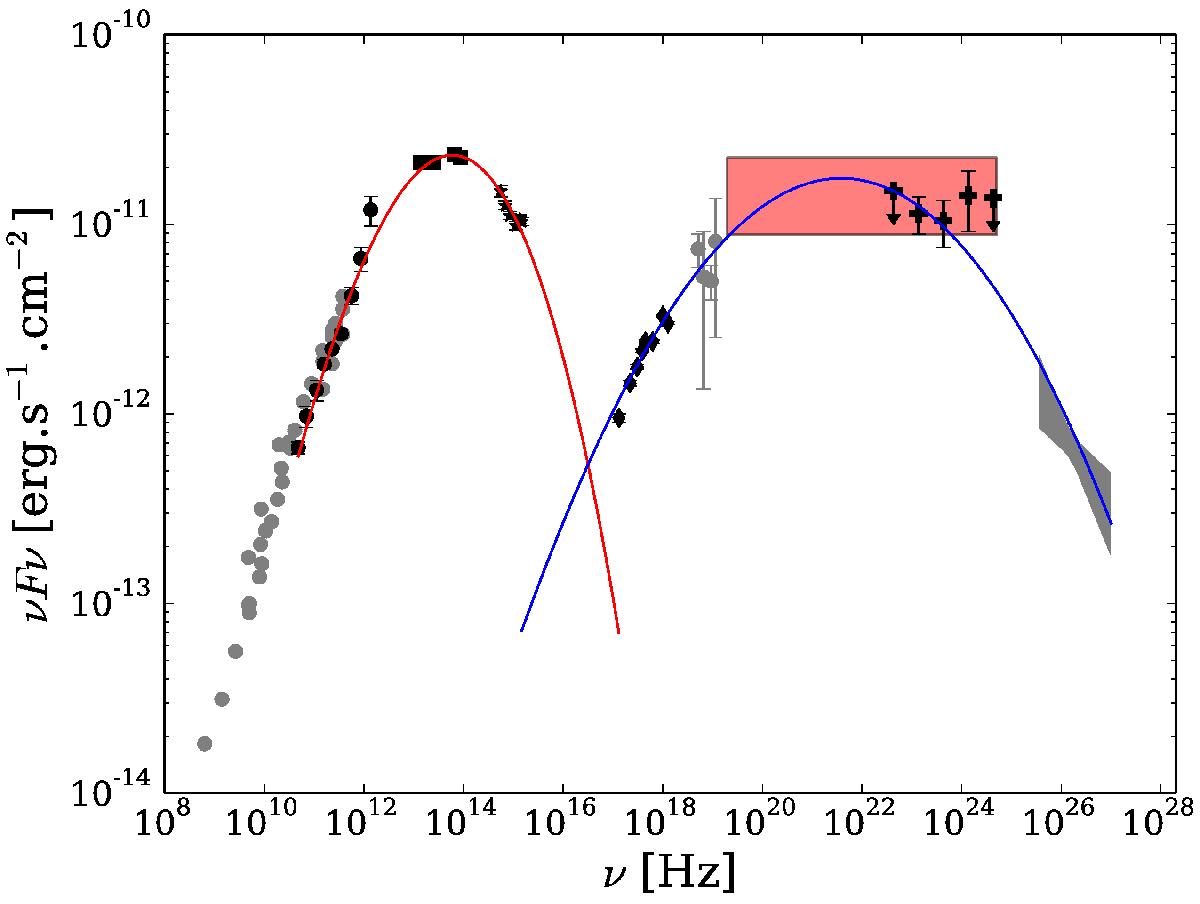
Interpolation of the Ap Lib SED by two-third degree polynomial functions, showing the synchrotron component (red) and the inverse-Compton component (blue). Black data: Simultaneous and quasi-simultaneous data, dots: Planck, Squares: WISE, stars: Swift-UVOT, diamonds: Swift-XRT, crosses: Fermi-LAT, grey dots: Archive data for informational purposes only, grey bow-tie:HESS. The red rectangle is the uncertainty area of the Compton peak position. Only quasi-simultaneous and HESS data are used for the interpolation.
Current usage metrics show cumulative count of Article Views (full-text article views including HTML views, PDF and ePub downloads, according to the available data) and Abstracts Views on Vision4Press platform.
Data correspond to usage on the plateform after 2015. The current usage metrics is available 48-96 hours after online publication and is updated daily on week days.
Initial download of the metrics may take a while.