Free Access
Fig. 6
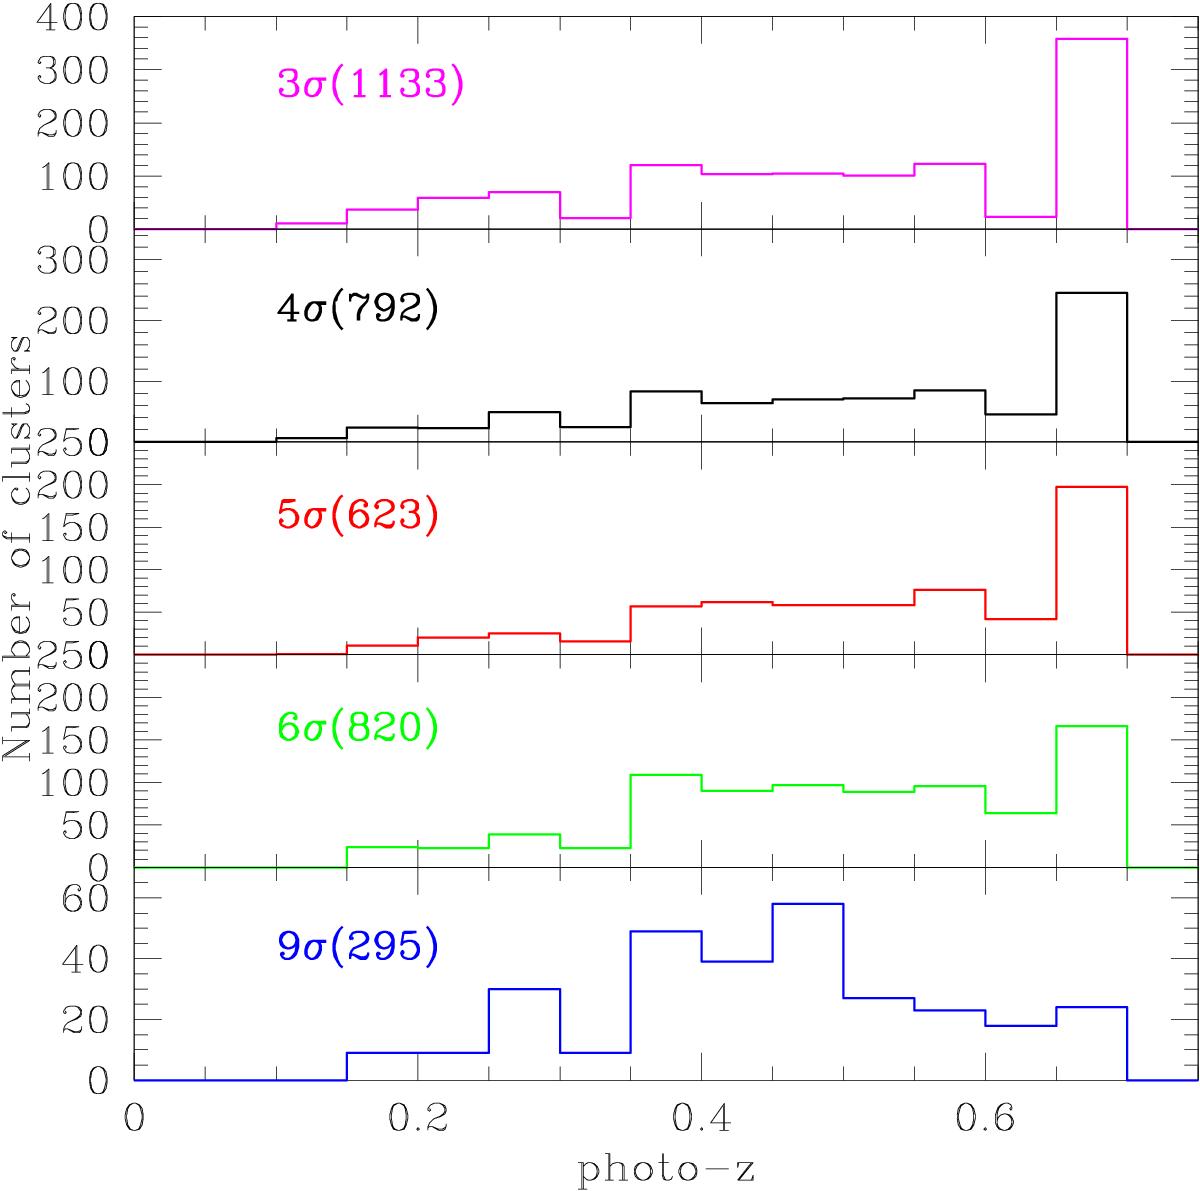
Photometric redshift histograms of the 3663 candidate clusters detected in S82 for various detection significance levels (indicated in each plot, together with the corresponding number of clusters in parentheses). For clarity, the scale of the y-axis is not the same for each plot.
Current usage metrics show cumulative count of Article Views (full-text article views including HTML views, PDF and ePub downloads, according to the available data) and Abstracts Views on Vision4Press platform.
Data correspond to usage on the plateform after 2015. The current usage metrics is available 48-96 hours after online publication and is updated daily on week days.
Initial download of the metrics may take a while.