Fig. 14
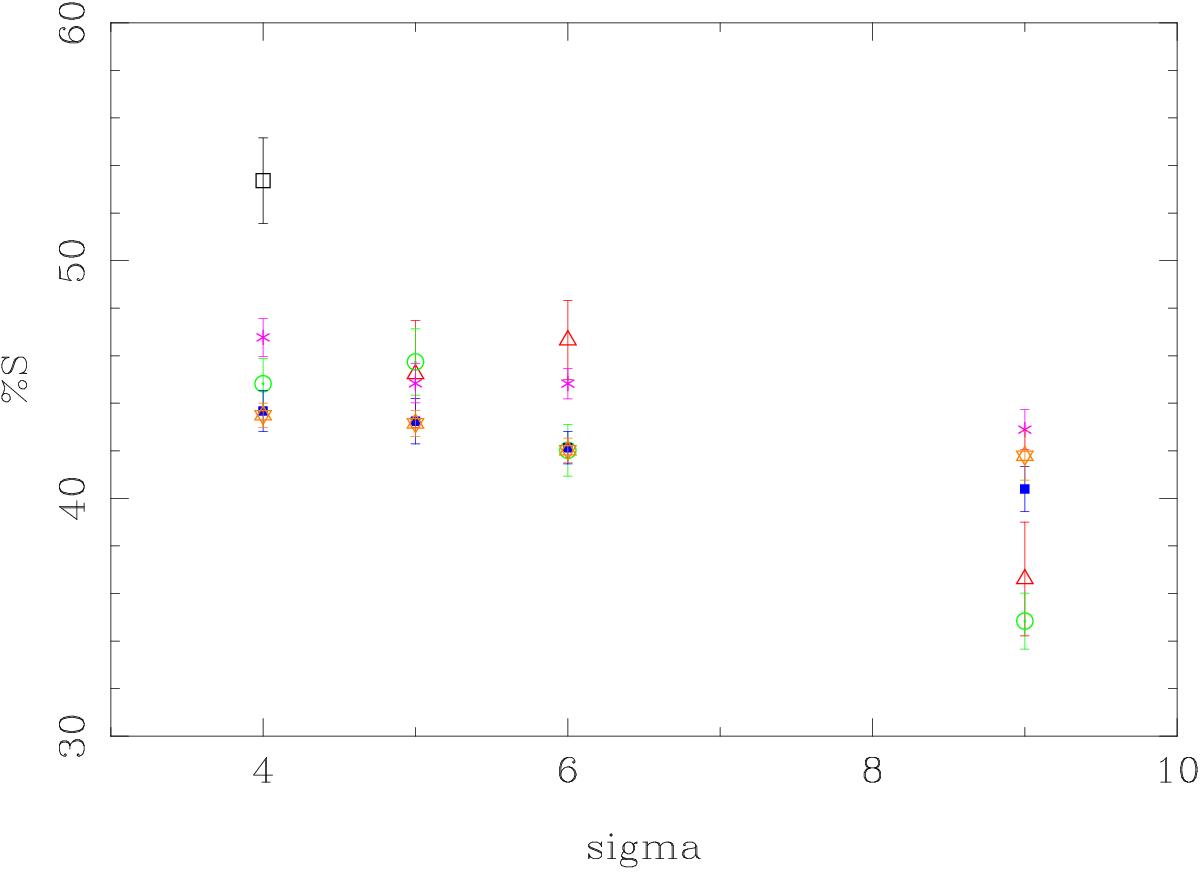
Percentage of late-type galaxies as a function of detection level, based on the bulge to disk decomposition in the r′ band. The data points are colour–coded in bins of redshift: black squares for z ≤ 0.2, red triangles for 0.2 <z ≤ 0.27, green circles for 0.27 <z ≤ 0.37, blue squares for 0.37 <z ≤ 0.47, magenta crosses for 0.47 <z ≤ 0.57, and orange stars for z> 0.57. The correction factors explained in the text have been applied.
Current usage metrics show cumulative count of Article Views (full-text article views including HTML views, PDF and ePub downloads, according to the available data) and Abstracts Views on Vision4Press platform.
Data correspond to usage on the plateform after 2015. The current usage metrics is available 48-96 hours after online publication and is updated daily on week days.
Initial download of the metrics may take a while.