Fig. 10
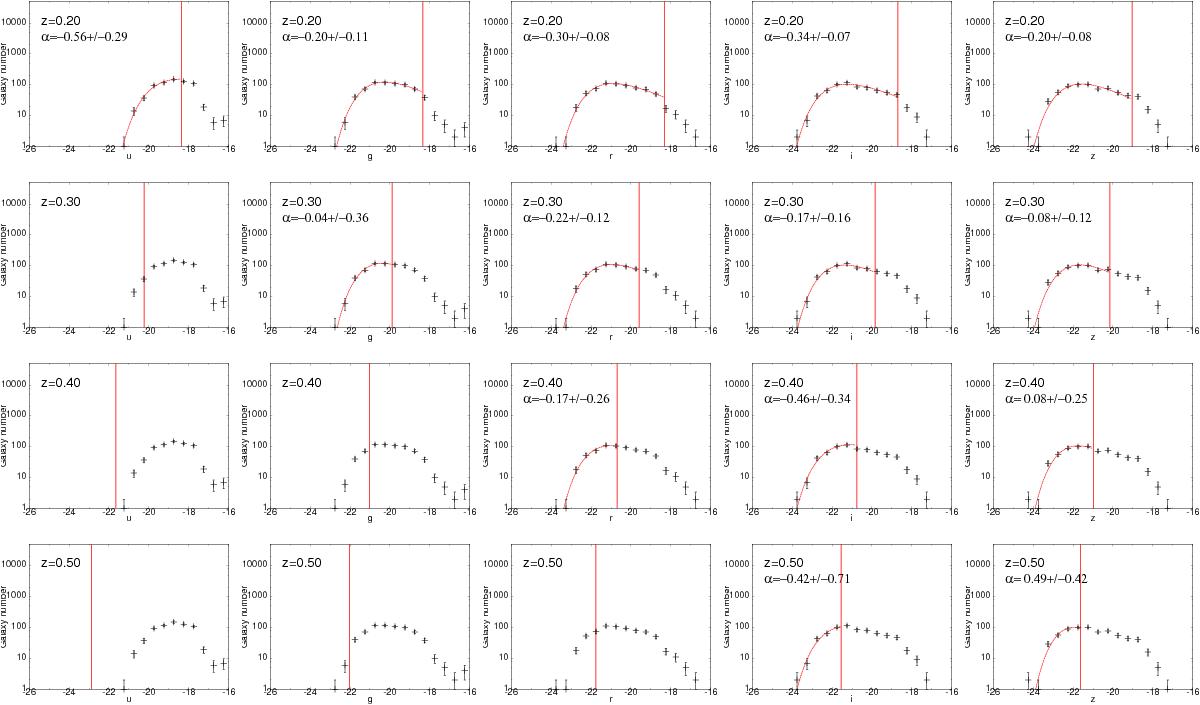
GLFs in the u,g,r,i and z bands (from left to right). Black crosses are the stacked GLFs with no surface normalization. The red curves are the best Schechter fits corresponding to the black crosses. The vertical red lines indicate the 90% completeness limits. Only galaxies brighter than the 90% completeness limit are taken into account for the fits. The plots for which no Schechter parameters are given in Table 4 are only shown for completeness, but will not be taken into account in the discussion.
Current usage metrics show cumulative count of Article Views (full-text article views including HTML views, PDF and ePub downloads, according to the available data) and Abstracts Views on Vision4Press platform.
Data correspond to usage on the plateform after 2015. The current usage metrics is available 48-96 hours after online publication and is updated daily on week days.
Initial download of the metrics may take a while.