Fig. 5
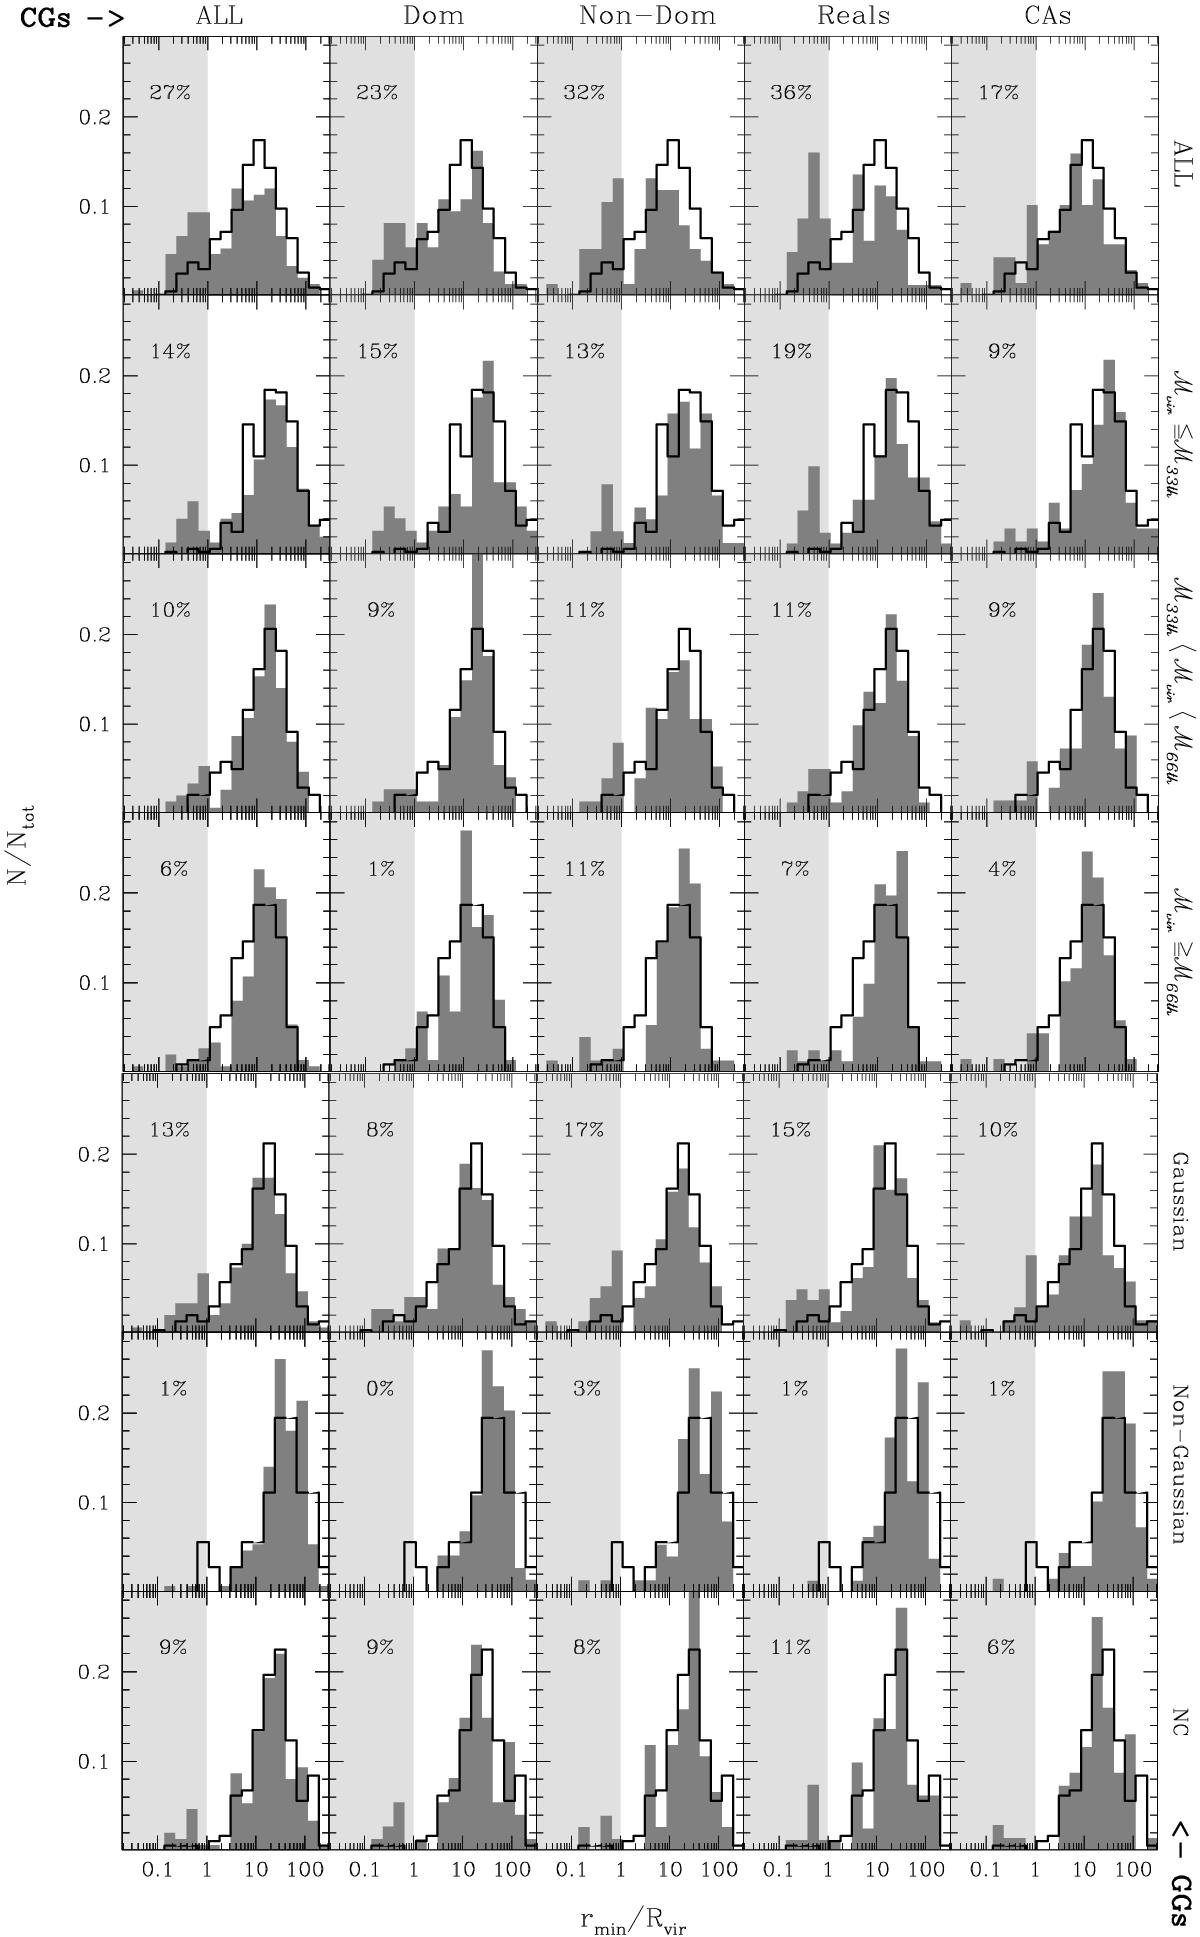
Distributions of the 3D smallest normalised separation in real space between compact and galaxy groups (dark grey histograms). Each column represents a different subsample of CGs, each row represents a different GG subsample. Each panel also shows the distribution of the 3D smallest separation in real space among the GGs (black empty histogram). The light-grey region in each panel determines the inner region of a GG. Inside that region we quote the percentage of compact groups that are expected to lie inside a GG (see Sect. 3.1 for a more detailed description of each subsample).
Current usage metrics show cumulative count of Article Views (full-text article views including HTML views, PDF and ePub downloads, according to the available data) and Abstracts Views on Vision4Press platform.
Data correspond to usage on the plateform after 2015. The current usage metrics is available 48-96 hours after online publication and is updated daily on week days.
Initial download of the metrics may take a while.