Fig. 4
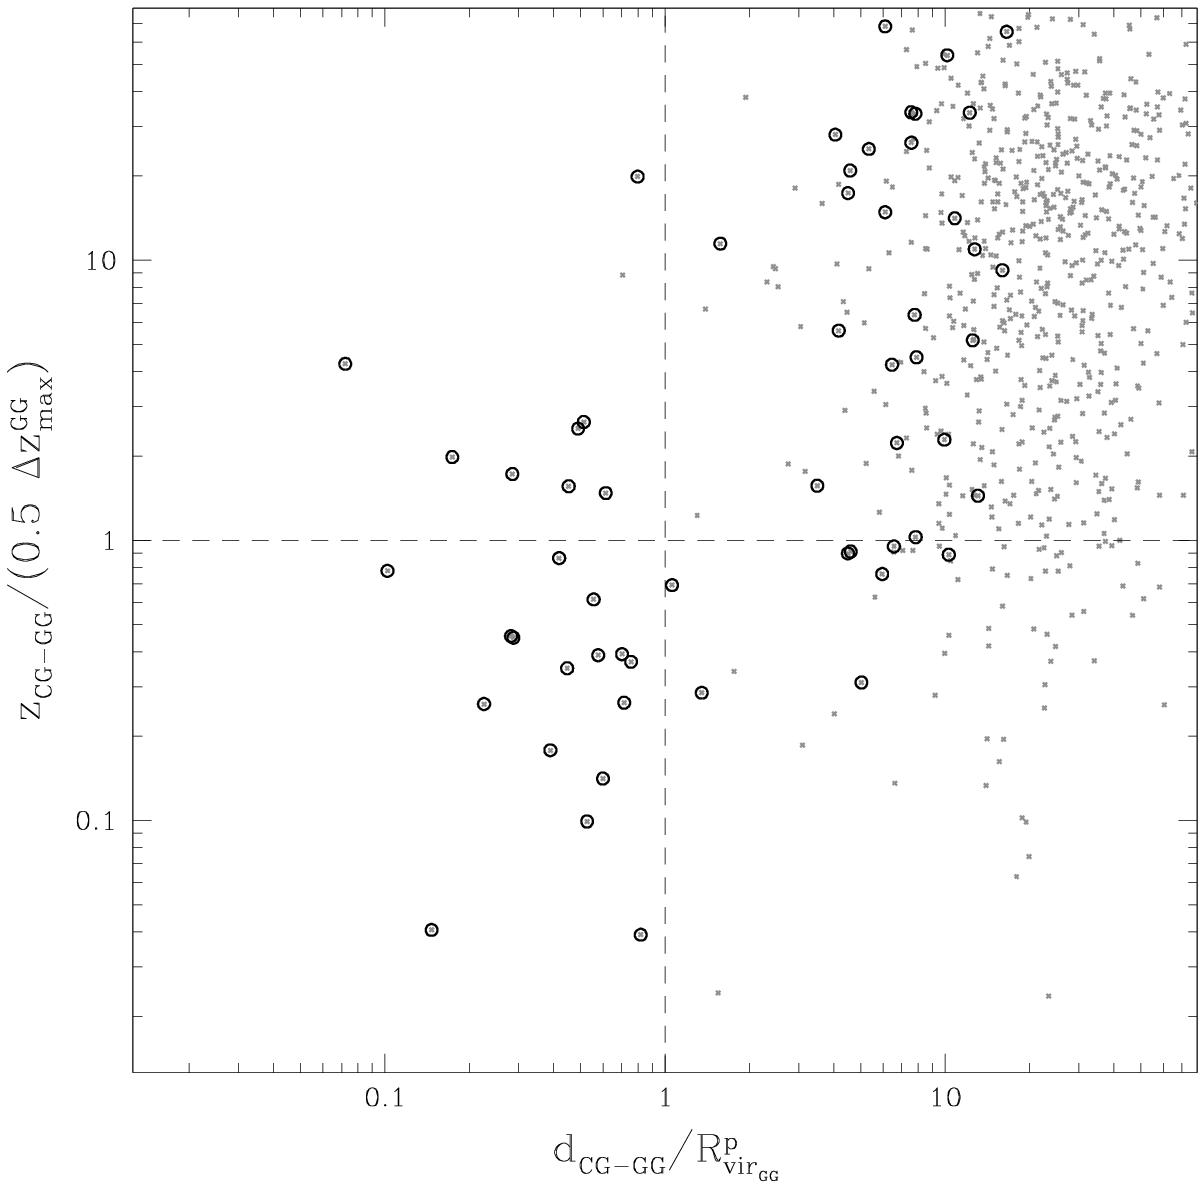
Scatter plot of normalised projected and normalised radial separations between CGs and GGs. The grey points show all the separations from each CG to all GGs in the sample, while open black circles are the smallest CG-GG separations only selected in projection. The dashed lines indicate unity in the normalised distances. Embedded CGs lie in the lower left corner (see Eq. (2)).
Current usage metrics show cumulative count of Article Views (full-text article views including HTML views, PDF and ePub downloads, according to the available data) and Abstracts Views on Vision4Press platform.
Data correspond to usage on the plateform after 2015. The current usage metrics is available 48-96 hours after online publication and is updated daily on week days.
Initial download of the metrics may take a while.