Fig. 3
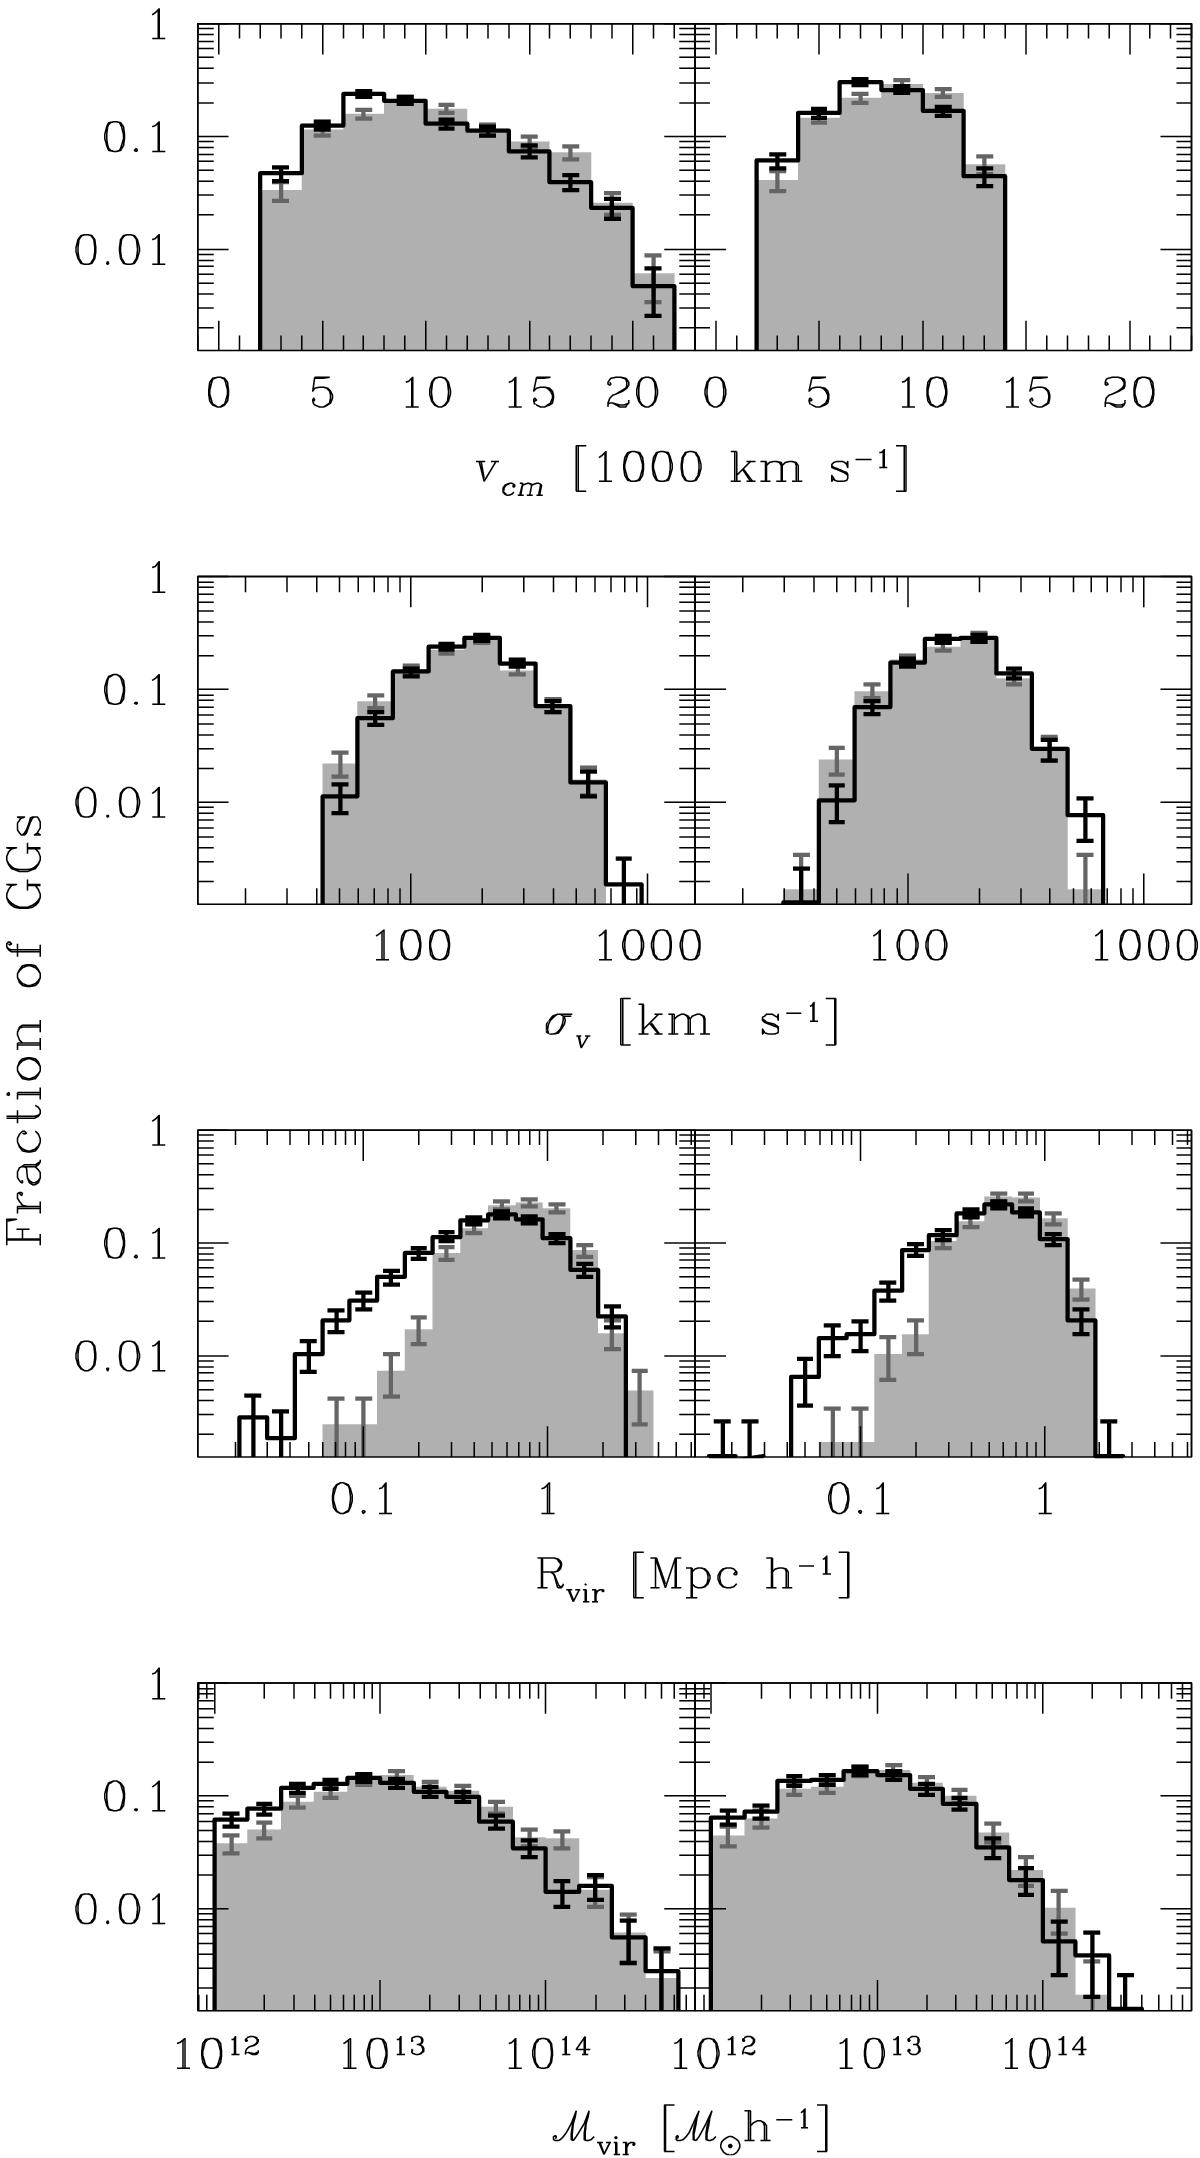
Properties of galaxy groups. The distributions correspond to mean radial velocities (first row panels), radial velocity dispersions (second row panels), 3D virial radii (third row panels) and virial masses (fourth row panels) of GGs. Error bars correspond to Poisson errors. Shaded histograms show the distributions of properties of observational galaxy groups identified in the 2M++, while empty histograms show the same properties for mock galaxy groups identified in a 2M++ mock catalogue. The left column corresponds to the complete sample of galaxy groups identified by the FoF algorithm with a contour overdensity contrast of 433. The right column corresponds to the sample of galaxy groups with a radial velocity restricted to span the same range as compact groups and excluding the galaxy groups that can be considered as already included in the sample of compact groups. In this column, the mock GGs have been restricted to those that have more than four members after applying a blending criterion to account for the size of the particles (see Sect. 4.2).
Current usage metrics show cumulative count of Article Views (full-text article views including HTML views, PDF and ePub downloads, according to the available data) and Abstracts Views on Vision4Press platform.
Data correspond to usage on the plateform after 2015. The current usage metrics is available 48-96 hours after online publication and is updated daily on week days.
Initial download of the metrics may take a while.