Fig. 2
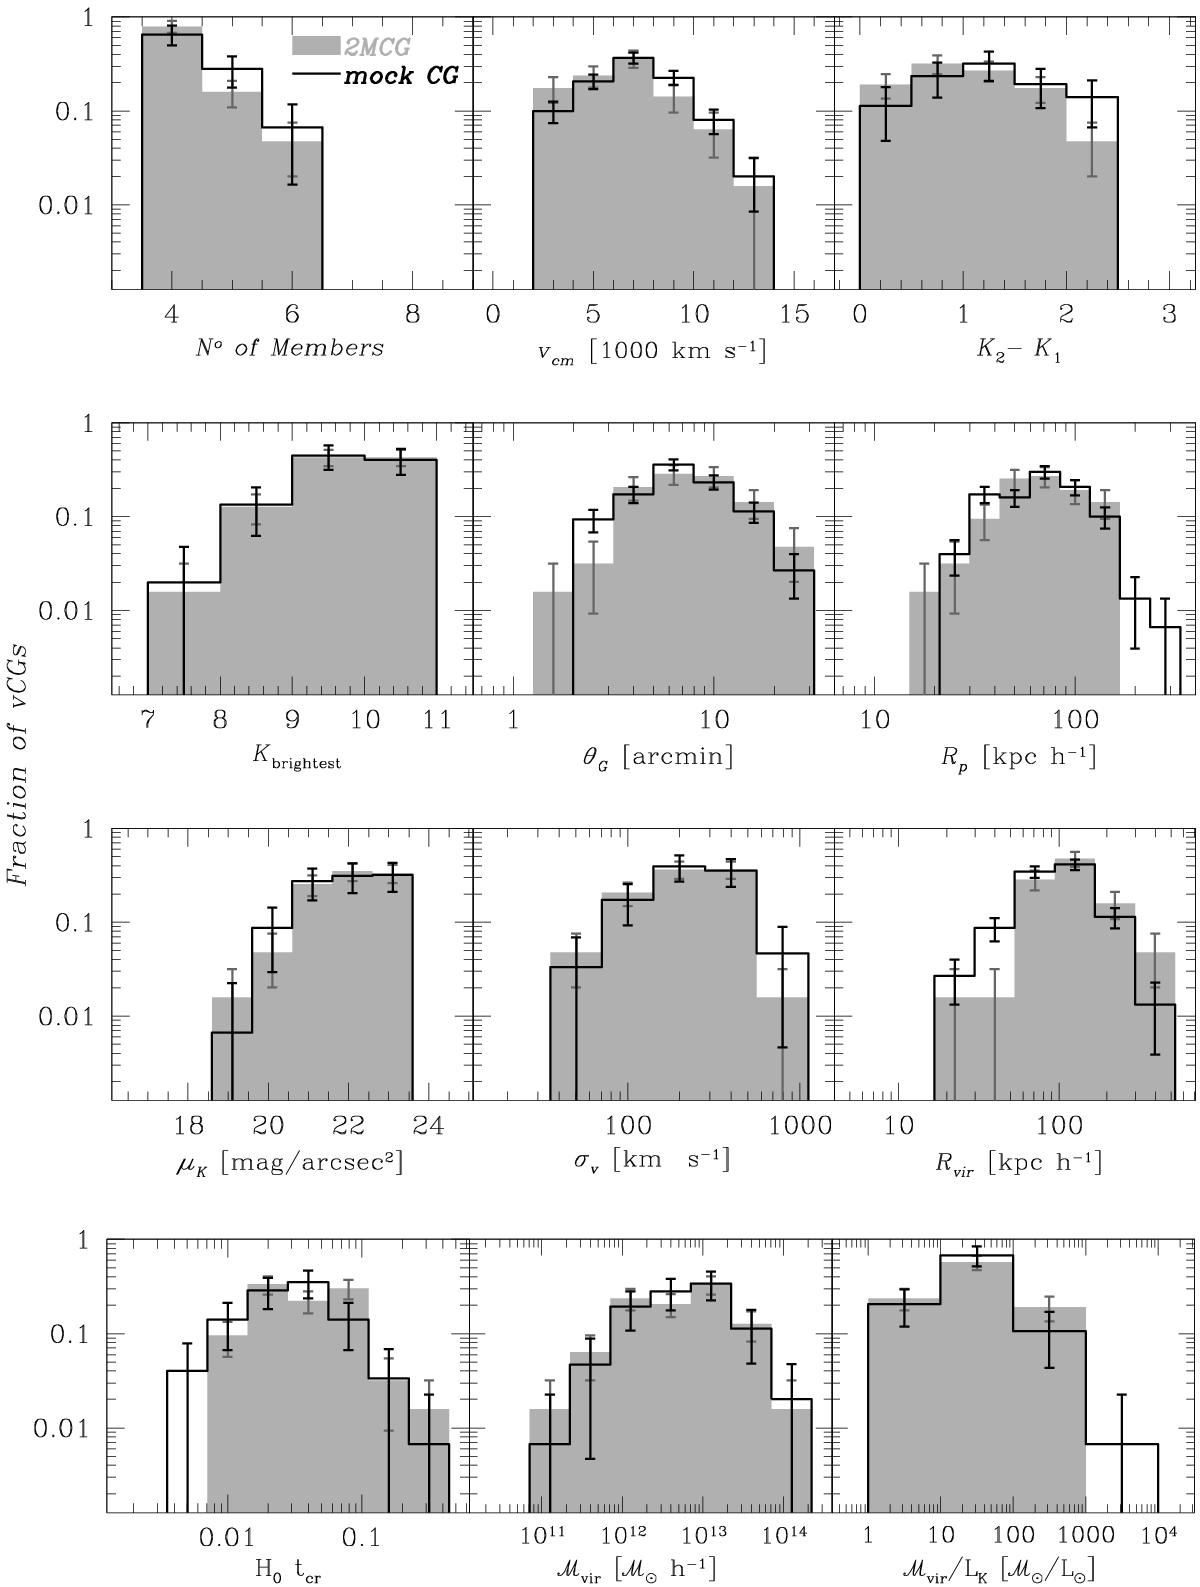
Distributions of observable properties of observational and semi-analytical CGs. Number of members (top left panel), median radial velocity (top centre panel), difference in absolute magnitude between the brightest and the second brightest galaxies (top right panel), Ks-band apparent magnitude of the brightest galaxy member (second row, left panel), angular diameter of the smallest circle that encloses the galaxy members (second row, centre panel), projected group radius (second row, right panel), group surface brightness (third row, left panel), radial velocity dispersion (third row, centre panel), group virial radius (third row, right panel), dimensionless crossing time (bottom left panel), group virial mass (bottom centre panel), and mass-to-light ratio (bottom right panel). Grey shaded histograms correspond to the observational sample of CGs (2MCGs) that lie on the 2M++ restricted area, while black empty histograms correspond to semi-analytical CGs. Error bars correspond to Poisson errors.
Current usage metrics show cumulative count of Article Views (full-text article views including HTML views, PDF and ePub downloads, according to the available data) and Abstracts Views on Vision4Press platform.
Data correspond to usage on the plateform after 2015. The current usage metrics is available 48-96 hours after online publication and is updated daily on week days.
Initial download of the metrics may take a while.