Fig. 4
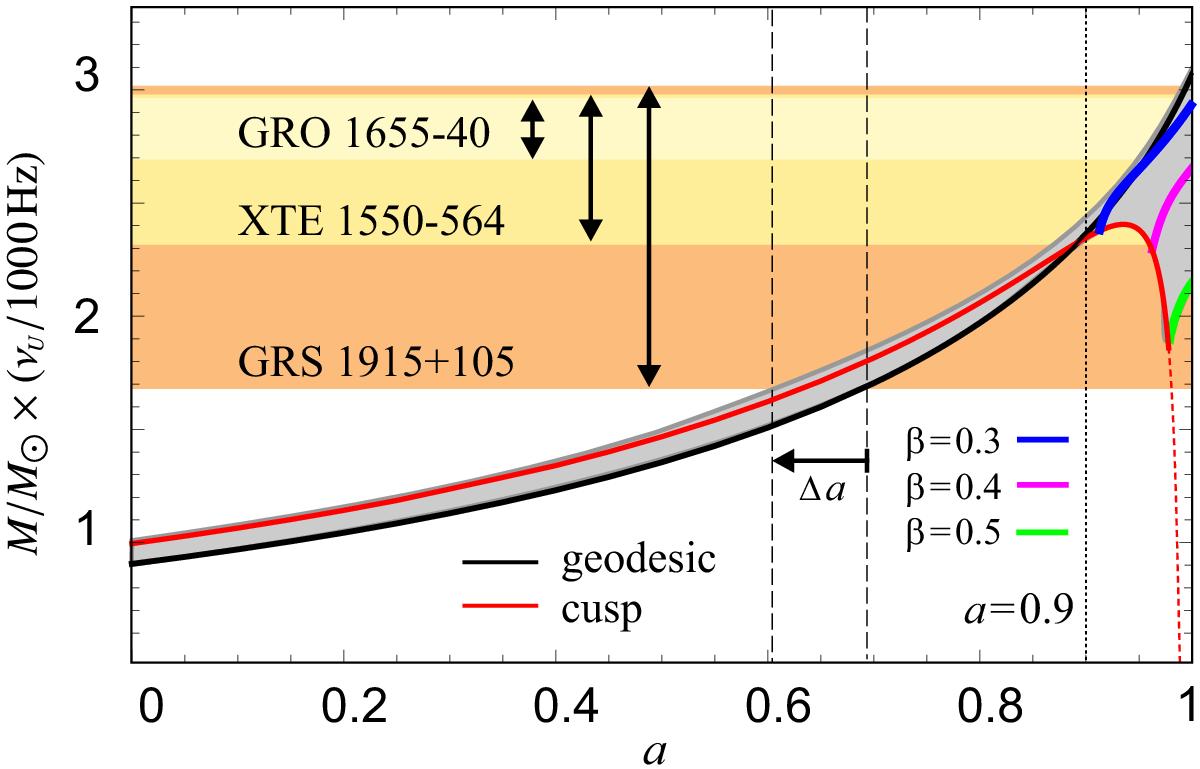
Observational bounds on the quantity M × νU obtained for Galactic microquasars vs. relations predicted by the epicyclic resonance model. The vertical areas denote the observational bounds on M × νU determined for GRS 1915+105, XTE J1550−564, and GRO J1655−40. The areas are drawn assuming the conservative limits from Table 1. The solid black curve shows predictions of the model calculated for the geodesic flow. The shaded region indicates the interval predicted by the model for the family of equilibrium non-slender fluid tori of all thicknesses possible in the particular case. The red curve corresponds to the case of tori with a cusp. The arrow labelled Δ a indicates the shift of the lower limit on the spin of microquasars implied by considering the non-geodesic flow.
Current usage metrics show cumulative count of Article Views (full-text article views including HTML views, PDF and ePub downloads, according to the available data) and Abstracts Views on Vision4Press platform.
Data correspond to usage on the plateform after 2015. The current usage metrics is available 48-96 hours after online publication and is updated daily on week days.
Initial download of the metrics may take a while.