Free Access
Fig. 1
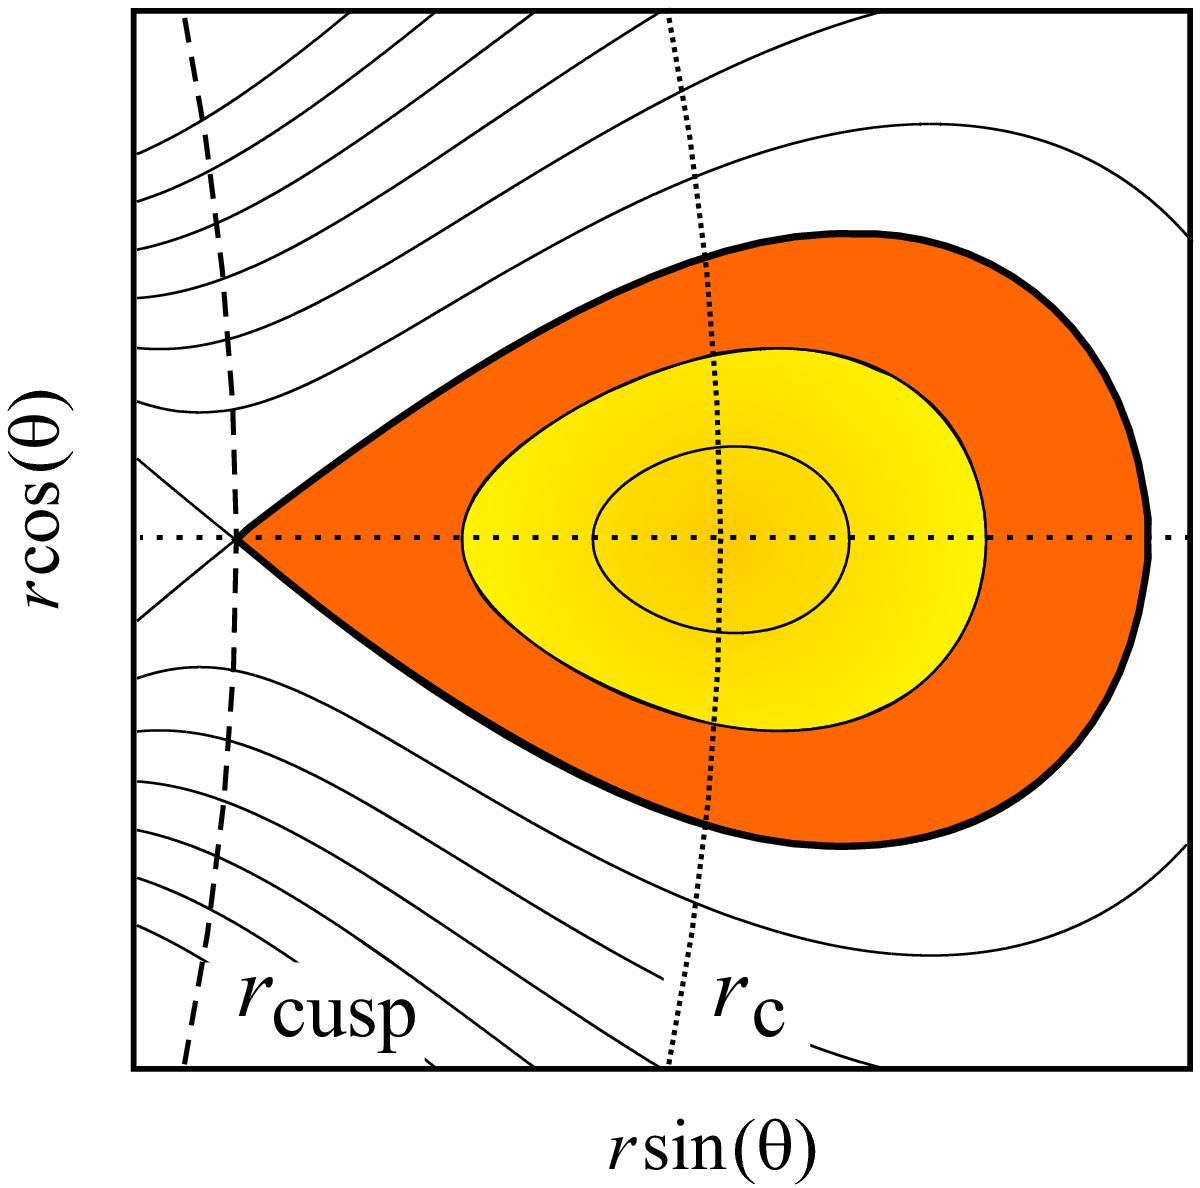
Illustration of equipotential surfaces of the accretion torus. The dotted horizontal line denotes the equatorial plane. The yellow region illustrates tori of various thickness. The orange region, together with the yellow, illustrates a torus filling the equipotential surface with a cusp.
Current usage metrics show cumulative count of Article Views (full-text article views including HTML views, PDF and ePub downloads, according to the available data) and Abstracts Views on Vision4Press platform.
Data correspond to usage on the plateform after 2015. The current usage metrics is available 48-96 hours after online publication and is updated daily on week days.
Initial download of the metrics may take a while.