| Issue |
A&A
Volume 578, June 2015
|
|
|---|---|---|
| Article Number | A34 | |
| Number of page(s) | 9 | |
| Section | Extragalactic astronomy | |
| DOI | https://doi.org/10.1051/0004-6361/201424854 | |
| Published online | 29 May 2015 | |
Intra-day variability observations and the VLBI structure analysis of quasar S4 0917+624⋆
1
Xinjiang Astronomical Observatory, Chinese Academy of
Sciences, 150 Science
1-Street, 830011
Urumqi, PR China
e-mail:
This email address is being protected from spambots. You need JavaScript enabled to view it.
2
Key Laboratory of Radio Astronomy, Chinese Academy of
Sciences, 2 West Beijing Road,
Nanjing, 210008
JiangSu, PR
China
3
University of Chinese Academy of Sciences,
100049
Beijing, PR
China
4
Max-Plank-Institut für Radioastronomie,
Auf dem Hügel 69, 53121
Bonn,
Germany
5
Dipartimento di Fisica e Astronomia, Università di
Padova, via Marzolo
8, 35131
Padova,
Italy
Received: 23 August 2014
Accepted: 15 April 2015
Abstract
Aims. The quasar S4 0917+624 is one of the targets in the Urumqi flux density monitoring program, which aims to study the properties of intra-day variable (IDV) extragalactic radio sources.
Methods. The IDV observations of S4 0917+624 were carried out monthly, from August 2005 to January 2010, with the Urumqi 25 m radio telescope at 4.8 GHz. We analyze these and previous IDV observations to investigate the long-term IDV characteristics of S4 0917+624. We also study the long-term structural variability on milliarcsecond scales using VLBI maps obtained at 15 GHz (taken from the MOJAVE database) in order to search for a possible relation between variations in the IDV pattern and the source structure.
Results. The quasar S4 0917+624 exhibits only very weak or no IDV during our 4.5 year observing interval. Prior to the year 2000, the source S4 0917+624 was one of the most prominent IDV sources. Our new data indicate that the previous strong IDV has ceased. We analyzed the long-term VLBI structural variability using Gaussian model-fitting. From this we obtained the flux densities and the deconvolved sizes of core and inner-jet components of the source. We studied the properties such as core fraction, angular size, spectral index, and brightness temperature of VLBI core for S4 0917+624, as well as the time delay between 5 and 15 GHz variations, and compared them with the IDV properties of S4 0917+624. The source shows ejection of several jet components that are suspected to have partially reduced the IDV amplitude of S4 0917+624. However, during 2005−2006, the VLBI core size was comparable to the size before the year 2000, but no strong IDV was detected in the period, suggesting that the quenching effect due to source size changes may not be responsible for the lack of strong IDV after the year 2000. The refractive scattering properties for the strong IDV phase of S4 0917+624 before the year 2000 are discussed.
Conclusions. The disappearance of strong IDV in S4 0917+624 after the year 2000 is a mystery and cannot be explained via the quenching effect by changes in the observable VLBI structure. However, it may be caused by changes in the interstellar medium, i.e. by interstellar weather, which induces changes in the scintillation pattern on timescales of several years. Further coordinated multi-frequency observations will be required to distinguish between the effect of source-intrinsic variability and changing properties of the interstellar medium.
Key words: quasars: individual: 0917+624 / radio continuum: galaxies / galaxies: jets / ISM: structure / scattering
Table 1 and Appendix A are available in electronic form at http://www.aanda.org
© ESO, 2015
1. Introduction
Intra-day variability (IDV) of active galactic nuclei (AGN) at centimeter wavelengths was discovered in the 1980s (Witzel et al. 1986; Heeschen et al. 1987). Significant IDV mainly occurs in flat spectrum radio sources, which belong to the class of radio-loud core-dominated AGN. Statistical studies suggest an IDV rate of 25%−50% in these flat-spectrum radio sources (Quirrenbach et al. 1992; Lovell et al. 2008) and an even higher rate of ~60% in gamma-ray bright Fermi blazars (Liu et al. 2012a). From the beginning of the discovery of IDV, both source-intrinsic and -extrinsic mechanisms were proposed to explain the IDV (see Wagner & Witzel 1995 for a review). In the source-intrinsic explanation, the flux variability on timescales of less than one day would imply very small sizes of the emitting regions and very high brightness temperatures (e.g. 1019 K for S4 0917+624, see Quirrenbach et al. 1989; Qian et al. 1991), seven orders of magnitude greater than the inverse-Compton limit of 1012 K (Kellermann & Pauliny-Toth 1969). These high brightness temperatures can only be reconciled with the inverse-Compton limit, assuming strong relativistic Doppler-boosting, with Doppler factors larger than ~100. Such high Doppler factors are not seen in VLBI. Alternatively, source extrinsic propagation effects, e.g. the interstellar scintillation (ISS) caused by the intervening line-of-sight material in our Galaxy, could be responsible for the observed IDV of compact sources (Rickett et al. 1995; 2007). In order to better understand the long-term behavior of IDV sources, we carried out an IDV monitoring program for a number of IDV sources, including quasar S4 0917+624 at the 6 cm band from August 2005 to January 2010 with the Urumqi 25 m radio telescope in Xinjiang Astronomical Observatory, China.
The quasar S4 0917+624 (OK 630, z = 1.453) was one of the first strong IDV sources found (Heeschen et al. 1987) with high variability amplitudes of ~10−15% occurring on timescales of ≤1 day. Jauncey & Macquart (2001) and Rickett et al. (2001) analyzed IDV data of S4 0917+624 and find a systematic variation of the variability timescale over the year. This effect – known as the annual modulation of IDV – is caused by the Earth orbiting around the Sun and corresponding systematic variations of the Earth velocity vector with respect to the stationary-assumed scintillating pattern. For more examples of the annual modulation of the IDV timescales, see Dennett-Thorpe & de Bruyn (2000), Bignall et al. (2003; 2006), Gabányi et al. (2007), Marchili et al. (2012), Liu et al. (2012b; 2013a).
In September 1998 the previously strong IDV of S4 0917+624 changed and suddenly became weaker (Kraus et al. 1999). This may be due to a prolonged variability timescale, which in the ISS model for S4 0917+624 is expected to appear in September (Rickett et al. 2001). The IDV started again in February 1999; however, from September 2000 to 2001 the IDV of S4 0917+624 then ceased completely (Fuhrmann et al. 2002; Kraus et al. 2003). The intermittency of IDV in S4 0917+624 may be due to changes in the interstellar medium properties and/or caused by an increased size of the scintillating components (Narayan 1992; Walker 1998; Krichbaum et al. 2002). Liu et al. (2013b) studied the total flux densities and spectral index of S4 0917+624, and found that the source spectral index became slightly steeper after the year 2000, implying that the source may become less core-dominated after 2000. A correlation between source spectral index and the ISS characteristics was found in a large sample of 140 sources by Koay et al. (2011). IDV sources may also be more variable intrinsically on longer timescales than non-IDV sources (Peng et al. 2000). However, high-resolution VLBI data are required to study whether variations in the source structure play a role in the variation of the IDV pattern of S4 0917+624.
In Sect. 2, we analyze our results from the Urumqi flux density monitoring observations together with previous IDV data of S4 0917+624; in Sect. 3, we study the long-term VLBI structural variability of the source; in Sect. 4, we discuss whether an overall relationship between rapid flux density and structural variability exists.
2. Urumqi observations and data reduction
We carried out IDV observations of S4 0917+624 approximately once a month at 4.8 GHz from August 2005 to January 2010 with the Urumqi 25 m radio telescope, in dual polarization with the central frequency of 4.8 GHz and bandwidth of 600 MHz. The typical system temperature is 24 K in clear weather, and the antenna sensitivity is ~0.12 K/Jy.
The IDV observations were performed in cross-scans mode, consisting of eight sub-scans in azimuth and elevation over the source position. After initial calibration of the raw data, the intensity profile of each sub-scan was fitted with a Gaussian function after subtracting a baseline; then the fitted scans were averaged in azimuth and elevation. After this, a correction for residual pointing errors was made and the elevation and azimuth scans were averaged together. In the next step an antenna gain-elevation correction was applied, including a correction for airmass. The antenna gain-elevation correction was derived from frequent observations of secondary calibrators observed during each observing run. These calibrators were then also used to correct the data for systematic time-dependent effects. Finally, the raw amplitudes were converted to the absolute flux density using the average scale of the primary calibrators, e.g. 3C 48, 3C 286, and NGC 7027 (Baars et al. 1977; Ott et al. 1994). The duration of each IDV monitoring session is about 3 days, with typically one sample per hour for each target source (where a sample is a set of eight sub-scans), from Table 1.
For the data analysis, we use the statistical quantities, such as the modulation index m (a measure of the amplitude of the variations); the variability amplitude Y, which is unbiased to the systematic calibration uncertainty; and the reduced chi-squared  , to describe the variability as shown below (see also Kraus et al. 2003),
 ![Mathematical equation: \begin{eqnarray} &&m[\%] = 100\frac{\sigma_{\rm s}}{\langle S\rangle}, \\ &&Y[\%] = 3\sqrt{m^2-m_0^2}, \\ &&\chi_{\rm r}^2 = \frac{1}{N-1}\sum\left(\frac{S_{\rm i}-\langle S\rangle}{\Delta S_{\rm i}}\right)^2, \end{eqnarray}](/articles/aa/full_html/2015/06/aa24854-14/aa24854-14-eq10.png) where σs is the standard deviation of flux densities from the mean flux density in a light curve, ⟨ S ⟩ is the mean flux density in the light curve, m0 is the mean modulation index of all secondary calibrators in the same observation, N is the number of measurements in the light curve, and Si and ΔSi denote individual flux density and its error.
where σs is the standard deviation of flux densities from the mean flux density in a light curve, ⟨ S ⟩ is the mean flux density in the light curve, m0 is the mean modulation index of all secondary calibrators in the same observation, N is the number of measurements in the light curve, and Si and ΔSi denote individual flux density and its error.
2.1. Result from Urumqi observations of S4 0917+624
In order to ascertain whether or not IDV is present, we applied a χ2 test to each data set. We adopt the criterion that a data set with a probability of ≤0.1% of being constant is considered to be variable, which is equivalent to the confidence level of 99.9% to define the IDV. From this analysis, we find that the source S4 0917+624 shows IDV in only 6 sessions, and does not show IDV in 24 sessions in Table 1. It may also be useful to look at the ratio of the variability index m to the mean modulation index of calibrators m0 (treated as 1σ): only two sessions show IDV at a 3σ level and six sessions show IDV at greater than 2.5σ. We therefore conclude that the strong IDV of S4 0917+624, which was frequently observed before the year 2000, was not present during our observations. As an example we show in Fig. 1 the light curve in April 2006, which shows a weak IDV and the light curve in August 2006, which does not show any significant variability.
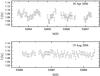 |
Fig. 1 Upper panel: weak IDV detected in the session of April 2006; lower panel: non-IDV detected in the session of August 2006, see the definition of IDV identification in the text. |
To estimate the variability timescale from the six detected weak IDV light curves (null probability <0.001 as defined above), we applied the structure function D(τ) method (Simonetti et al. 1985). In the first-order structure function, the shortest characteristic variability timescale is located at the first plateau where the structure function saturates. A structure function D(τ) that monotonically increases with time lag can be described by a power law. The shortest variability timescale is then defined by the intersection of this power-law fit with a horizontal line, which fits the plateau (see Marchili et al. 2012; Liu et al. 2012b). In the present paper, for consistency we used the Rickett et al. (1995; 2001) definition of IDV timescale, which is defined at half of the D(τ) saturation level, i.e. τ0.5, in Table 1 and in the Appendix. Since the plateau or saturation level sometimes is not well defined for the weak IDV, the estimated timescale is only tentative for the Urumqi data in Table 1. The results derived from the 30 observing sessions of S4 0917+624 are shown in Table 1.
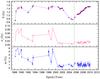 |
Fig. 2 Upper panel: total flux density of S4 0917+624 at ~5 GHz in the IDV observations; middle panel: the rms flux density at ~5 GHz; lower panel: IDV modulation index at ~5 GHz versus time, the error on m is the mean modulation index of calibrators. Urumqi data from August 2005 to January 2010 are shown to the right of the vertical line. |
2.2. Historical IDV characteristics of S4 0917+624
In Table A.1 we list the results of previous IDV observations for S4 0917+624 (1988−2004) taking from the literature. The total flux density, rms flux density, and the modulation index of IDV in S4 0917+624 at ~5 GHz, together with the Urumqi data from August 2005 to January 2010, are shown in Fig. 2. It is obvious that after the year 2000, the IDV of S4 0917+624 is very weak or has ceased. Using the IDV data before 2000 (shown in the Appendix) we obtain the following results: the total flux density shows no correlation with the modulation index; the rms flux density shows a correlation with the modulation index; and the IDV timescale shows no correlation with either the total flux density or the modulation index. The total flux density from the Urumqi observations shows a monotonous increase over the 4.5 years, and during this time the IDV of S4 0917+624 has been mostly quenched. We confirm the lack of strong IDV after the year 2000. We note, however, that some weak IDV is present in six epochs of the Urumqi observations (Table 1) and may also be in some epochs during 2003−2004 in the Effelsberg data (Bernhart 2010, see the Appendix). Before the year 2000 (see Fig. 2 and the Appendix), the source frequently showed strong IDV, but we note that times exist during which the IDV was also weak (e.g. in April 1993 and in September 1998). This implies some intermittency of the IDV of S4 0917+624 also appeared before the year 2000.
3. Long-term VLBI structure changes of S4 0917+624
The radio image of S4 0917+624 appears point-like on kpc scales, and VLBI images at 5 GHz reveal a one-sided core-jet structure (Standke et al. 1996; Gabuzda et al. 2000). A comparison between the IDV strength and structural changes observed with VLBI may help to explain and understand the substantially reduced IDV amplitudes after the year 2000. The IDV of S4 0917+624 was mainly observed at 5 GHz in the past, unfortunately the source was not regularly monitored with VLBI at 5 GHz. However, the source has been monitored with the VLBA at 15 GHz since 1995 (MOJAVE program, see Lister et al. 2009). The 15 GHz VLBI data have a higher angular resolution than at 5 GHz, and are suitable for the study of the structural evolution of the compact components in S4 0917+624.
We downloaded the calibrated data (January 1995 to November 2010) of S4 0917+624 at 15 GHz from the MOJAVE database and fitted the source structure using Gaussian components within the DIFMAP package. Figure 3 shows an example of a VLBA image at 15 GHz. The jet features were fitted with several circular Gaussian components, with the VLBI core (C0) registered at the southernend of the jet-like brightness distribution. Each data set was model-fitted several times to obtain a better error estimation. The typical errors are ~5% for flux density and ~0.05 mas for angular size and position of the fitted VLBI components, respectively. For their cross-identification in the maps obtained at different epochs, we used the VLBI core as the reference point and assumed that it is stationary. With this method we identify the jet components at different epochs through their distances from the VLBI core, their flux densities, sizes, and relative position angles. The resulting identification is similar to that described in Lister et al. (2013).
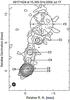 |
Fig. 3 VLBA map of S4 0917+624 at 15 GHz observed on 17 July 2008. the contours are the peak 0.81 Jy/beam times: −0.05, 0.05, 0.1, 0.2, 0.4, 0.8, 1.6, 3.2, 6.4, 12.8, 25.6, 51.2 (%); the beam FWHM: 0.664 × 0.632 mas with the major axis at 21.7°. |
In Fig. 4, we show the proper motion of the jet components with respect to the stationary assumed VLBI core component. The back-extrapolation of the motions of the jet components C3, C4, C5, C6, C8, and C9 to zero-separation from the VLBI core results in approximate ejection epochs around 1986.1, 1992.3, 1995.8, 1997.2, 2004.2, and 2001.8. In Table 2 we summarize the kinematical parameters of the jet components at 15 GHz. For the determination of the apparent speeds, we adopt ΛCDM standard cosmology, with the following parameters: H0 = 71 km s-1 Mpc-1, ΩM = 0.27, and ΩΛ = 0.73. Taking into account the opacity effect (Sokolovsky et al. 2011; Pushkarev et al. 2012), we note that the ejection time of a jet component may be delayed at 5 GHz when compared to that at 15 GHz. Furthermore, it is found that there are helical jet trajectories from the inner to outer jets, but the inner jets can be fitted quasi-linearly (Bernhart 2010).
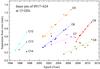 |
Fig. 4 Separation of the model-fitted components relative to the core component against time. The solid lines are the linear fittings. We note that the identifications of components C7, C12, C13, and C14 are only tentative. |
Fitted Gaussian components and derived properties from the VLBA images at 15 GHz.
In our model-fittings of S4 0917+624, 14 components are registered as listed in Table 2, the core and inner-jet components are mostly within 1 mas scale. We note that for some components (C7, C10, C11, C12, C13, C14) the identification remains tentative because of the lack of data. The other components, however, are well traced by their systematic proper motions. The component C14 may be related to C5 or C7. The VLBI components that might affect the IDV behavior of the source should be strong and compact (e.g. see Lee et al. 2008). Therefore only the core and compact inner-jet components will contribute substantially to the overall scintillation pattern of the source. In the following, we will not consider the diffuse/weak components C1, C2, C3, C4, C10, C11 (with mean flux <0.05 Jy in Table 2) and component C7 (which is quite weak and not well identified).
The components C5 and C6 were ejected in 1995.8 and 1997.2 respectively at 15 GHz, and both are quite strong in flux density. An emerging component can lead to an expansion of the apparent core size, at a time when it is not yet well separated from the core. An increased “core size” could reduce the IDV amplitude (Walker 1998; Krichbaum et al. 2002). The weak IDV in September 1998 might be due to component C5 being ejected in 1995.8, if C5 was still blending with the core at 5 GHz. Afterwards from September 2000 to 2001, the IDV of S4 0917+624 ceased completely (Fuhrmann et al. 2002; Kraus et al. 2003), which might have been caused by C6 being ejected in 1997.2. The components C9 and C8 were ejected in 2001.8 and 2004.2, both are strong in flux density. The component C8 exhibits a higher apparent velocity of βapp = (10.2 ± 0.5)c than component C9 of βapp = (3.7 ± 0.9)c. The components C9 and C8 might have partially reduced the IDV of S4 0917+624 after 2003. Pushkarev et al. (2012) estimated the VLBA core shifts between 15.4 GHz and 8.1, 8.4, 12.1 GHz for the MOJAVE sources. With their result for S4 0917+624 and the relation of core shift versus frequency rc ∝ ν-1 (see Pushkarev et al. 2012), the core shift between 15 and 5 GHz can be estimated, and then with the proper motion listed in Table 2 we estimate the time delay for the components C5, C6, C8, and C9 are of 1.4 ± 0.2, 1.7 ± 0.4, 1.1 ± 0.1, and 3.1 ± 1.5 years, respectively, between 15 and 5 GHz.
The ratio (fc) of the flux density of VLBI component to source total flux density shows that the 15 GHz VLBI core has flux ratios of fc ~ 28%−88%, and nearly half of the inner-jet components within 1 mas from the core have fc> 25%. In Fig. 5b the flux ratios for the VLBI core and inner-jet components with fc> 25% are plotted. We note that the flux ratio of the VLBI core is generally higher after the year 2000.
In Fig. 5c, the angular sizes of the VLBI core and main inner-jet components versus time are illustrated. The angular size is defined as the full width at half maximum (FWHM) of the fitted circular Gaussian (in some epochs the core was better fitted by an elliptical Gaussian, for which we use the geometrical mean of the major and minor FWHM). Figure 5c shows that the core size significantly increased in 2002−2003, but before and after this period the core sizes were similarly low. The sizes of the inner-jet components have increased since 2007 as a result of the expansion of components C8 and C9. The increased size of the VLBI core in 2002−2003 may have led to a partially quenched IDV of S4 0917+624. However, the sizes of the VLBI core and inner-jet components are relatively small in 2005−2006 and comparable to that before year 2000, and no strong IDV has been observed during this period. It is also helpful to fit the broad “core region” (see Fig. 3) with a single elliptical Gaussian model rather than with multiple components; the resulting size evolution in Fig. 5d is similar to the trend seen for the inner-jet components.
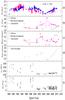 |
Fig. 5 From top to bottom: a) total flux density at 14.5 GHz (from the UMRAO database) and at 4.8 GHz (from the UMRAO and the IDV observations); b) flux ratio (fc) of the VLBA core or inner-jet component to total flux density of S4 0917+624; c) angular size of the VLBA core or inner-jet components at 15 GHz; d) size of the broad “core region” fitted with a single Gaussian model; e) rms flux density at 5 GHz versus time; f) IDV modulation index at 5 GHz versus time. |
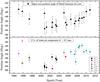 |
Fig. 6 Upper panel: position angle of the 15 GHz VLBA core versus time; lower panel: position angles of the inner-jet components versus time. |
4. Discussion
The VLBI images of S4 0917+624 at 5 GHz show a ~60−70% of total flux density in the core region (<1 mas) at 5 GHz (Standke et al. 1996; Gabuzda et al. 2000). The core region is resolved into a 15 GHz core and inner jets (see Fig. 3), with a lower core fraction (Fig. 5b) at 15 GHz than that of ~60−70% at 5 GHz. Rickett et al. (1995) made a detailed and sophisticated analysis of S4 0917+624 during its phase of large-amplitude IDV. The results of the detailed modeling with the refractive ISS (RISS) by Rickett et al. (1995) show that the scintillating component of S4 0917+624 at 5 GHz has an angular size of ~70 μas with flux fraction of ~44%, under the brightness temperature of ~6 × 10¹² K. Assuming the scintillating component resides in the VLBI core, for the modulation index ms of the scintillating component with the flux fraction fs, and the modulation index of total flux density m, we have  (4)where θr is the angular size of refractive scattering disk and θs is the size of scintillating source component (see e.g. Rickett et al. 1995; Walker 1998).
For a point source (i.e. θs = θr), by taking the value m ~ 5.5% in the episode strong IDV phase before the year 2000 (in the Appendix) and fs = 44%, we have ms ~ 13%. This is much lower than the value of mp ~ 50% for a point source estimated by Rickett et al. (1995), implying that the scintillating component of S4 0917+624 is not a point source, i.e. the size of the scattering disk is <70 μas of the scintillating component. Such small angular size was not resolved in the 5 GHz VLBI observations (Standke et al. 1996; Gabuzda et al. 2000), but from the deconvolved core size in the model fitting on the 15 GHz VLBA data, a higher resolution of ~100 μas at 15 GHz was estimated in some epochs (Fig. 5c) for S4 0917+624. It is possible that changes in a very high brightness (≤100 μas) component embedded in the core region could be related to changes in the ISS. Such high radio brightness of AGN cores has been reported to be significantly above the known inverse-Compton limit in the Radioastron space VLBI observations (Kovalev 2014).
Liu et al. (2013b) noted that the spectral index between 5 and 15 GHz (defined as S ∝ ν+ α) became slightly steeper, being in the range −0.1 to 0.2 before the year 2000, and −0.3 to −0.1 after 2000. This may have been caused by the new jet components C6, C8, and C9 evolved after 2000. The jets usually have steeper spectral indices. In Fig. 5b, the core fraction at 15 GHz increased after the year 2000, implying that the 15 GHz VLBI core may blend with inner-jet components that were not resolved with the 15 GHz VLBI yet. The VLBI core size can be enlarged owing to the unresolved inner jet, and could partially quench the IDV of S4 0917+624, e.g. for the VLBI core size increased in 2002−2003 (Fig. 5c). However, in 2005−2006 the VLBI core size is comparable to that before 2000, and it is difficult to explain why there was no strong IDV in this period. Hovatta et al. (2014) investigated the spectral indices of the MOJAVE sources observed at 8.1, 8.4, 12.1, and 15.4 GHz with the VLBA, in which the VLBA core of S4 0917+624 on 9 August 2006 showed very flat spectral index (0.04) as well as three inner jets (≤0.5 mas from the core) with flat spectral indices | α | < 0.1. This flat spectrum core would be able to scintillate, but no IDV has been found from the Urumqi observation in August 2006 (see Table 1).
The position angle changes of source components may also affect the scintillation (Liu et al. 2012b). We find that the position angles (PA) of the 15 GHz VLBI core and inner jets changed a few degrees to the west after the year 2000 (Fig. 6), and this could induce an apparently larger core size in projection. This effect may be significant if the scintillating component is extremely anisotropic. In January 2010, the PA of the 15 GHz VLBI core returned back to ~–46°, but no strong IDV was detected, suggesting that the quenching effect due to the small PA changes is not significant for this source.
The intra-day flux variations of S4 0917+624 showed no time delay from different radio bands (Rickett et al. 1995). Long-term variations of AGN have shown time delays of a few tens of days between different radio bands (Fuhrmann et al. 2014). With the radio light curves of S4 0917+624 at 4.8 GHz and 14.5 GHz from the UMRAO data, as well as the data from the 5 GHz IDV observations in Table 1 and the Appendix (see Fig. 5a), we estimated an upper limit of ~1 year for the time delay between the 15 and 5 GHz with the cross correlation analysis. This upper limit is close to but lower than that from the core shift estimation in the previous section. And we should note that both the VLBA data at 15 GHz and the IDV data at 5 GHz are relatively sparse and do not exactly match each other in time. This might prevent us from detailed comparison of the VLBI structure changes and the IDV evolution; for instance, there are no IDV data around the VLBA observations during 1995.0−1997.5. After the year 2000, however, it is evident that the IDV characteristics in Fig. 5e and f have no correlation with the VLBI structural changes in Fig. 5b to d, although there are weak IDV in three epochs from August 2005 to June 2006 (see Table 1) when the 15 GHz VLBA core size is relatively small (see Fig. 5c and also the images in the MOJAVE webpage1).
The disappearance of strong IDV in S4 0917+624 after the year 2000 cannot be fully explained with the quenching mechanism via changes of core size in the source, as discussed above. Bernhart et al. (2006) studied the VLBI kinematics of S4 0917+624 with data during 2000−2007 at 5, 15, and 22 GHz, and also did not find clear correlation between the IDV properties and VLBI structure. The disappearance is likely caused by a change of ISM scattering properties, e.g. with the passage of scattering material out of the line of sight to the quasar, as discussed for the fast IDV source J1819+3845, which also ceased at some time in the period between June 2006 and February 2007 (de Bruyn & Macquart 2015), and for the intermittent IDV source PKS 0405−385 (Kedziora-Chudczer 2006).
To identify the possible scattering materials located in the foreground of S4 0917+624, which has the distance ~200 pc estimated with the shortest timescale in the appendix by Rickett et al. (1995; 2001), we have compared the source position with existing data archive of various ISM materials (e.g. radio loops and dust emission). The source lies on the border of Loop-III (Berkhuijsen et al. 1971) about 150−200 pc from us, as well as on the local enhancement of IRAS dust emission, which may be formed by interactions of radio loops with the ambient medium or with other structures. The consequence of such a collision is a dense turbulent local structure, which is responsible for the required enhanced scattering material producing ISS (Linsky et al. 2008). Ramachandran et al. (2006) found that the small-scale properties of the intervening plasma as it drifts through the sight line is evident with dispersion measure variations of pulsar timing, which causes the refractive scintillation timescales from days to months. However, further studies on the interstellar weather toward S4 0917+624 are required, e.g. with multi-frequency single dish and VLBI polarimetry to measure Faraday rotation and possibly detect variations of the rotation measure in the foreground screen (e.g. see Gabányi et al. 2009), and with spectral line observations (Malamut et al. 2014) and the observation of pulsars near the line of sight to detect the ISM intermittency, which could be related to the changing IDV pattern.
5. Summary and conclusion
We presented the result of S4 0917+624 observed with the Urumqi 25 m telescope from August 2005 to January 2010. The quasar exhibits almost no IDV in our observations, which is in contrast with the previous pronounced IDV before year 2000. We also analyzed the long-term VLBI structural variability by using Gaussian model-fitting of the 15 GHz VLBA data, and obtained the flux densities and the deconvolved sizes of core and inner-jet components of the source. The source shows ejection of several jet components that are suspected to have partially reduced the IDV amplitude of S4 0917+624. However, during 2005−2006, the VLBI core size was comparable to the size before the year 2000, but no strong IDV was detected in the period. We studied the properties such as core fraction, angular size, spectral index, and brightness temperature of VLBI core for S4 0917+624, as well as the time delay between 5 and 15 GHz variations, and compared these values with the IDV properties of S4 0917+624. With the current data, the vanishing strong IDV in S4 0917+624 after the year 2000 cannot be explained via the quenching effect by changes in the observable VLBI structure. However, it may be caused by changes in the interstellar medium, i.e. by interstellar weather, which induces changes in the scintillation pattern on timescales of several years. The refractive scattering properties for the strong IDV phase of S4 0917+624 before the year 2000 have been discussed. Further coordinated multi-frequency observations will be required to distinguish between the effect of source-intrinsic variability and changing properties of the interstellar medium.
Online material
Results from the IDV observations of quasar S4 0917+624 with the Urumqi 25 m telescope at 4.8 GHz.
Appendix A
Collected historical IDV results of S4 0917+624 at ~5 GHz.
Acknowledgments
We acknowledge the referee for valuable comments that have improved the paper a lot. M.L.G. thanks M. Lister and G.-Y Zhao for helpful comments on the model fitting method to the VLBA data. This work is supported by the National Natural Science Foundation of China (No. 11273050); the 973 Program 2015CB857100; Key Laboratory of Radio Astronomy, Chinese Academy of Sciences; and the program of the Light in China’s Western Region (Grant No. YBXM-2014-02). N.M. is funded by an ASI fellowship under contract number I/005/11/0. This research has made use of data from the MOJAVE database that is maintained by the MOJAVE team (Lister et al. 2009). This research has made use of data from the University of Michigan Radio Astronomy Observatory which has been supported by the University of Michigan and by a series of grants from the National Science Foundation, most recently AST-0607523.
References
- Baars, J. W. M., Genzel, R., Pauliny-Toth, I. I. K., et al. 1977, A&A, 61, 99 [NASA ADS] [Google Scholar]
- Berkhuijsen, E. M., Haslam, C. G. T., & Salter, C. J. 1971, A&A, 14, 252 [NASA ADS] [Google Scholar]
- Bernhart, S. 2010, Ph.D. Thesis, Universitäts-und Landesbibliothek Bonn [Google Scholar]
- Bernhart, S., Krichbaum, T. P., Fuhrmann, L., & Kraus, A. 2006, PoS(8thEVN)013 [Google Scholar]
- Bignall, H. E., Jauncey, D. L., Lovell, J. E., et al. 2003, ApJ, 585, 653 [NASA ADS] [CrossRef] [Google Scholar]
- Bignall, H. E., Macquart, J.-P., Jauncey, D. L., et al. 2006, ApJ, 652, 1050 [NASA ADS] [CrossRef] [Google Scholar]
- de Bruyn, A. G., & Macquart, J.-P. 2015, A&A, 574, A125 [NASA ADS] [CrossRef] [EDP Sciences] [Google Scholar]
- Dennett-Thorpe, J., & de Bruyn, A. G. 2000, ApJ, 529, L65 [NASA ADS] [CrossRef] [PubMed] [Google Scholar]
- Fuhrmann, L., Krichbaum, T. P., Cimò, G., et al. 2002, PASA, 19, 64 [Google Scholar]
- Fuhrmann, L., Larsson, S., Chiang, J., et al. 2014, MNRAS, 441, 1899 [NASA ADS] [CrossRef] [Google Scholar]
- Gabányi, K. E., Marchili, N., Krichbaum, T. P., et al. 2007, A&A, 470, 83 [NASA ADS] [CrossRef] [EDP Sciences] [Google Scholar]
- Gabányi, K. E., Marchili, N., Krichbaum, T. P., et al. 2009, A&A, 508, 161 [NASA ADS] [CrossRef] [EDP Sciences] [Google Scholar]
- Gabuzda, D. C., Kochenov, P. Yu., Kollgaard, R. I., & Cawthorne, T. V. 2000, MNRAS, 315, 229 [NASA ADS] [CrossRef] [Google Scholar]
- Heeschen, D. S., Krichbaum, T. P., Schalinski, C. J., & Witzel, A. 1987, AJ, 94, 1493 [NASA ADS] [CrossRef] [Google Scholar]
- Hovatta, T., Aller, M. F., Aller, H. D., et al. 2014, AJ, 147, 143 [NASA ADS] [CrossRef] [Google Scholar]
- Jauncey, D. L., & Macquart, J. P. 2001, A&A, 370, L9 [NASA ADS] [CrossRef] [EDP Sciences] [Google Scholar]
- Kedziora-Chudczer, L. 2006, MNRAS, 369, 449 [NASA ADS] [CrossRef] [Google Scholar]
- Kellermann, K. I., & Pauliny-Toth, I. I. K. 1969, ApJ, 155, L71 [NASA ADS] [CrossRef] [Google Scholar]
- Koay, J. Y., Macquart, J. P., Rickett, R. J., et al. 2011, ApJ, 142, 108 [Google Scholar]
- Kovalev, Y. Y. 2014, IAU Symp., 304, 78 [NASA ADS] [Google Scholar]
- Kraus, A., Witzel, A., Krichbaum, T. P., et al. 1999, A&A, 352, L107 [NASA ADS] [Google Scholar]
- Kraus, A., Krichbaum, T. P., Wegner, R., et al. 2003, A&A, 401, 161 [NASA ADS] [CrossRef] [EDP Sciences] [Google Scholar]
- Krichbaum, T. P., Kraus, A., Fuhrmann, L., et al. 2002, PASA, 19, 14 [Google Scholar]
- Lee, S.-S., Lobanov, A. P., Krichbaum, T. P., et al. 2008, AJ, 136, 159 [NASA ADS] [CrossRef] [Google Scholar]
- Linsky, J. L., Rickett, B. J., & Redfield, S. 2008, ApJ, 675, 413 [NASA ADS] [CrossRef] [Google Scholar]
- Lister, M. L., Aller, H. D., Aller, M. F., et al. 2009, AJ, 137, 3718 [NASA ADS] [CrossRef] [Google Scholar]
- Lister, M. L., Aller, H. D., Aller, M. F., et al. 2013, AJ, 146, 120 [NASA ADS] [CrossRef] [Google Scholar]
- Liu, X., Song, H.-G., Liu, J., et al. 2012a, Res. Astron. Astrophys., 12, 147 [NASA ADS] [CrossRef] [Google Scholar]
- Liu, X., Song, H.-G., Marchili, N., et al. 2012b, A&A, 543, A78 [NASA ADS] [CrossRef] [EDP Sciences] [Google Scholar]
- Liu, B.-R, Liu, X., Marchili, N., et al. 2013a, A&A, 555, A134 [NASA ADS] [CrossRef] [EDP Sciences] [Google Scholar]
- Liu, X., Li, Q.-W., Krichbaum, T. P., et al. 2013b, Ap&SS, 346, 15 [NASA ADS] [CrossRef] [Google Scholar]
- Lovell, J. E. J., Rickett, B. J., Macquart, J.-P., et al. 2008, ApJ, 689, 108 [NASA ADS] [CrossRef] [Google Scholar]
- Malamut, C., Redfield, S., Linsky, J. L., et al. 2014, ApJ, 787, 75 [NASA ADS] [CrossRef] [Google Scholar]
- Marchili, N., Krichbaum, T. P., Liu, X., et al. 2012, A&A, 542, A121 [NASA ADS] [CrossRef] [EDP Sciences] [Google Scholar]
- Narayan, R., 1992, R. Soc. Lond. Philos. Trans. Ser. A, 341, 151 [Google Scholar]
- Ott, M., Witzel, A., Quirrenbach, A., et al. 1994, A&A, 284, 331 [NASA ADS] [Google Scholar]
- Peng, B., Kraus, A., Krichbaum, T. P., & Witzel, A. 2000, A&AS, 145, 1 [NASA ADS] [CrossRef] [EDP Sciences] [Google Scholar]
- Pushkarev, A. B., Hovatta, T., Kovalev, Y. Y., et al. 2012, A&A, 545, A113 [NASA ADS] [CrossRef] [EDP Sciences] [Google Scholar]
- Qian, S. J., Quirrenbach, A., Witzel, A., et al. 1991, A&A, 241, 15 [NASA ADS] [Google Scholar]
- Quirrenbach, A., Witzel, A., Qian, S. J., et al. 1989, A&A, 226, L1 [NASA ADS] [Google Scholar]
- Quirrenbach, A., Witzel, A., Krichbaum, T. P., et al. 1992, A&A, 258, 279 [NASA ADS] [Google Scholar]
- Ramachandran, R., Demorest, P., Backer, D. C., et al. 2006, ApJ, 645, 303 [NASA ADS] [CrossRef] [Google Scholar]
- Rickett, B. J. 2007, Astron. Astrophys. Trans., 26, 429 [NASA ADS] [CrossRef] [Google Scholar]
- Rickett, B. J., Quirrenbach, A., Wegner, R., et al. 1995, A&A, 293, 479 [NASA ADS] [Google Scholar]
- Rickett, B. J., Witzel, A., Kraus, A., et al. 2001, ApJ, 550, L11 [NASA ADS] [CrossRef] [Google Scholar]
- Simonetti, J. H., Cordes, J. M., & Heeschen, D. S. 1985, ApJ, 296, 46 [NASA ADS] [CrossRef] [Google Scholar]
- Sokolovsky, K. V., Kovalev, Y. Y., Pushkarev, A. B., et al. 2011, A&A, 532, A38 [NASA ADS] [CrossRef] [EDP Sciences] [Google Scholar]
- Standke, K. J., Quirrenbach, A., Krichbaum, T. P., et al. 1996, A&A, 306, 27 [NASA ADS] [Google Scholar]
- Wagner, S. J., & Witzel, A. 1995, ARA&A, 33, 163 [NASA ADS] [CrossRef] [Google Scholar]
- Walker, M. A. 1998, MNRAS, 294, 307 [NASA ADS] [CrossRef] [Google Scholar]
- Witzel, A., Heeschen, D. S., Schalinski, C., & Krichbaum, T. 1986, Mitt. Astron. Ges., 65, 239 [Google Scholar]
All Tables
Fitted Gaussian components and derived properties from the VLBA images at 15 GHz.
Results from the IDV observations of quasar S4 0917+624 with the Urumqi 25 m telescope at 4.8 GHz.
All Figures
|
Fig. 1 Upper panel: weak IDV detected in the session of April 2006; lower panel: non-IDV detected in the session of August 2006, see the definition of IDV identification in the text. |
| In the text | |
|
Fig. 2 Upper panel: total flux density of S4 0917+624 at ~5 GHz in the IDV observations; middle panel: the rms flux density at ~5 GHz; lower panel: IDV modulation index at ~5 GHz versus time, the error on m is the mean modulation index of calibrators. Urumqi data from August 2005 to January 2010 are shown to the right of the vertical line. |
| In the text | |
|
Fig. 3 VLBA map of S4 0917+624 at 15 GHz observed on 17 July 2008. the contours are the peak 0.81 Jy/beam times: −0.05, 0.05, 0.1, 0.2, 0.4, 0.8, 1.6, 3.2, 6.4, 12.8, 25.6, 51.2 (%); the beam FWHM: 0.664 × 0.632 mas with the major axis at 21.7°. |
| In the text | |
|
Fig. 4 Separation of the model-fitted components relative to the core component against time. The solid lines are the linear fittings. We note that the identifications of components C7, C12, C13, and C14 are only tentative. |
| In the text | |
|
Fig. 5 From top to bottom: a) total flux density at 14.5 GHz (from the UMRAO database) and at 4.8 GHz (from the UMRAO and the IDV observations); b) flux ratio (fc) of the VLBA core or inner-jet component to total flux density of S4 0917+624; c) angular size of the VLBA core or inner-jet components at 15 GHz; d) size of the broad “core region” fitted with a single Gaussian model; e) rms flux density at 5 GHz versus time; f) IDV modulation index at 5 GHz versus time. |
| In the text | |
|
Fig. 6 Upper panel: position angle of the 15 GHz VLBA core versus time; lower panel: position angles of the inner-jet components versus time. |
| In the text | |
Current usage metrics show cumulative count of Article Views (full-text article views including HTML views, PDF and ePub downloads, according to the available data) and Abstracts Views on Vision4Press platform.
Data correspond to usage on the plateform after 2015. The current usage metrics is available 48-96 hours after online publication and is updated daily on week days.
Initial download of the metrics may take a while.