Fig. 2
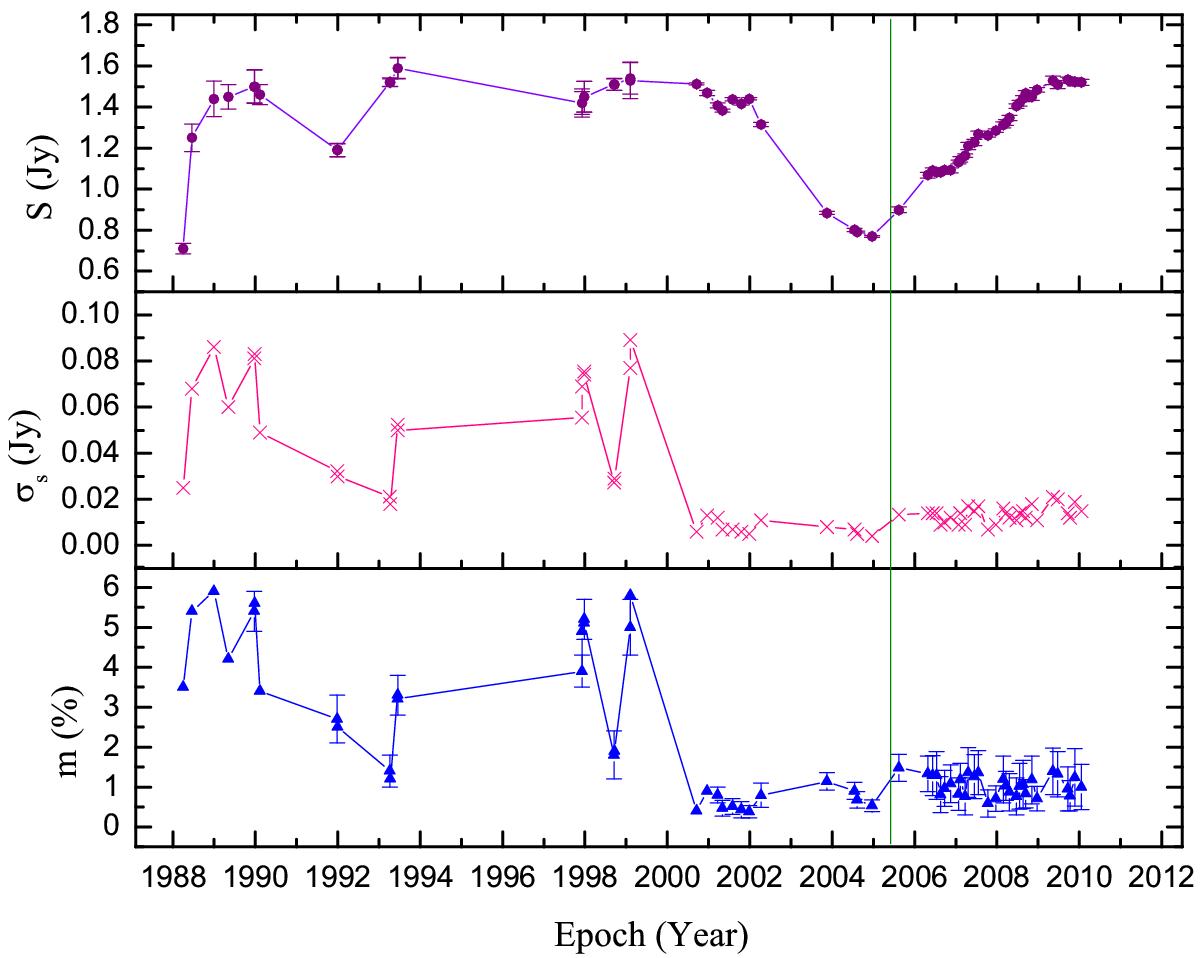
Upper panel: total flux density of S4 0917+624 at ~5 GHz in the IDV observations; middle panel: the rms flux density at ~5 GHz; lower panel: IDV modulation index at ~5 GHz versus time, the error on m is the mean modulation index of calibrators. Urumqi data from August 2005 to January 2010 are shown to the right of the vertical line.
Current usage metrics show cumulative count of Article Views (full-text article views including HTML views, PDF and ePub downloads, according to the available data) and Abstracts Views on Vision4Press platform.
Data correspond to usage on the plateform after 2015. The current usage metrics is available 48-96 hours after online publication and is updated daily on week days.
Initial download of the metrics may take a while.