Fig. 5
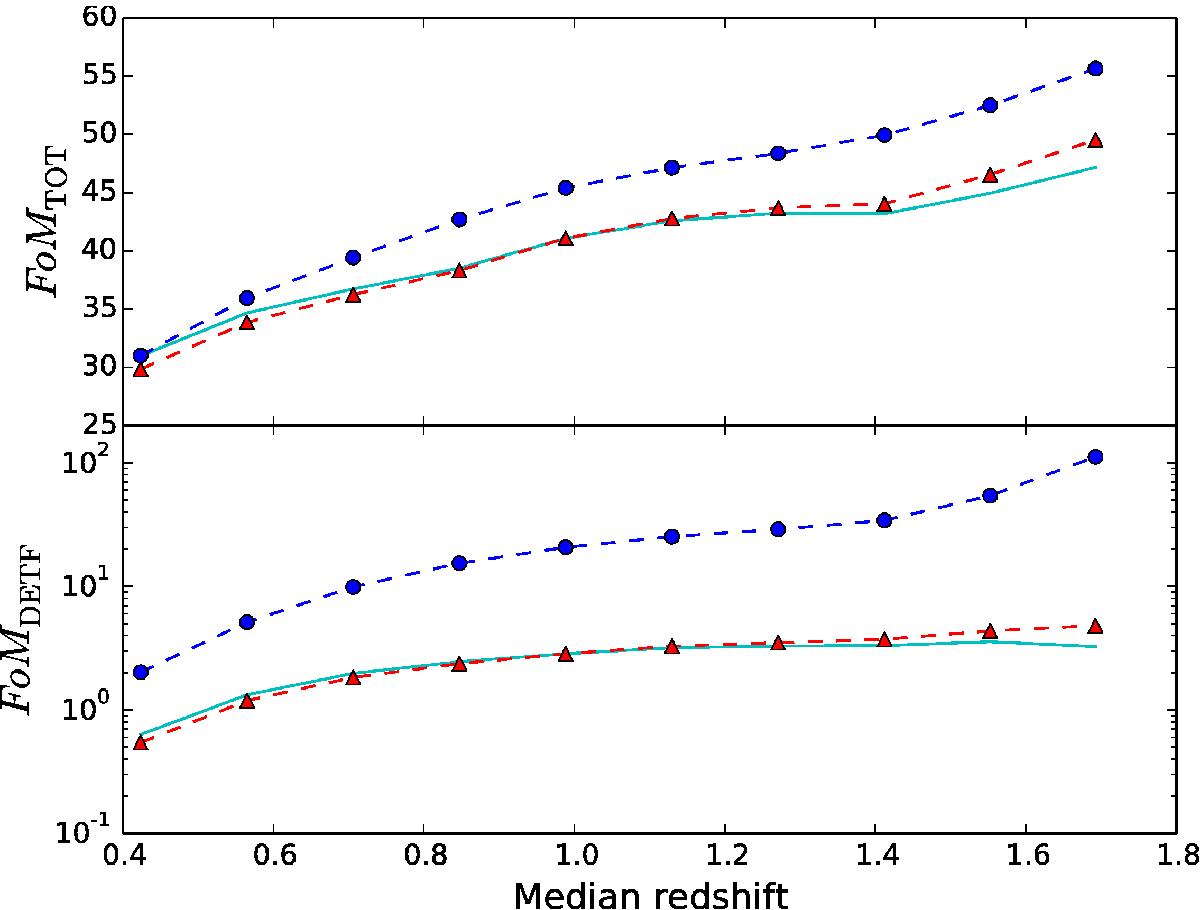
Total FoMTOT (top) and dark energy FoMDETF (bottom) figures of merit as a function of median redshift of a stage-IV spectroscopic survey using a tomographic analysis (red triangles) and an SFB analysis (blue dots). The cyan line shows the figures of merit for the tomographic analysis when the number of bins is not adapted to the depth of the survey and kept at 30 bins. For the red-dashed lines, the number of bins has been adapted to each median redshift. In all cases, a grid of 5 × 5 nuisance parameters in scale and redshift is used to parametrise the galaxy bias.
Current usage metrics show cumulative count of Article Views (full-text article views including HTML views, PDF and ePub downloads, according to the available data) and Abstracts Views on Vision4Press platform.
Data correspond to usage on the plateform after 2015. The current usage metrics is available 48-96 hours after online publication and is updated daily on week days.
Initial download of the metrics may take a while.