Fig. 2
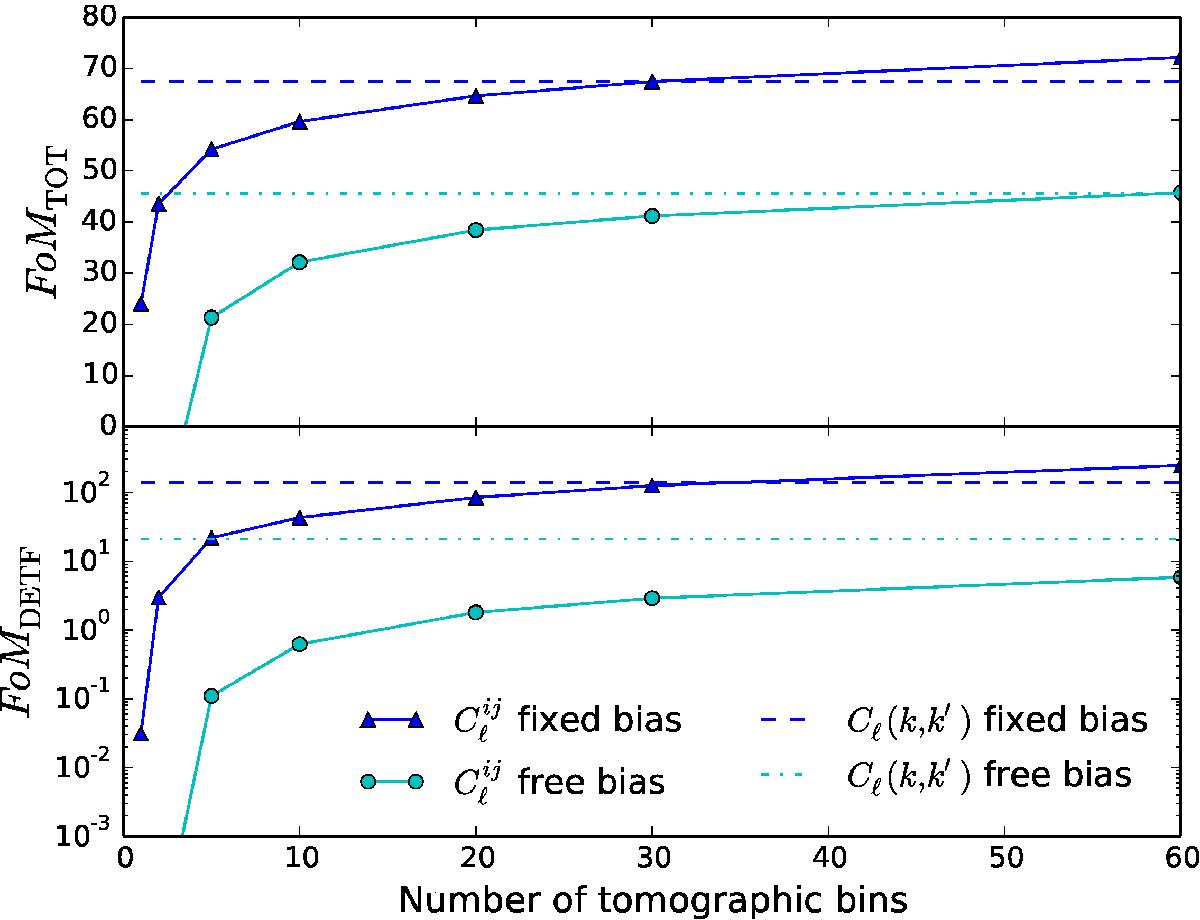
Comparison of the total FoMTOT (top) and dark energy FoMDETF (bottom) figures of merit for the 3D Fourier-Bessel analysis (horizontal dashed lines) vs. tomographic analysis (solid lines) as a function of number of redshift bins. The upper lines (dashed and triangle) result from assuming a fixed bias, the lower lines (dotted and circle) are obtained when assuming a grid of 5 × 5 nuisance parameters in scale and redshift described in Sect. 3.1.5.
Current usage metrics show cumulative count of Article Views (full-text article views including HTML views, PDF and ePub downloads, according to the available data) and Abstracts Views on Vision4Press platform.
Data correspond to usage on the plateform after 2015. The current usage metrics is available 48-96 hours after online publication and is updated daily on week days.
Initial download of the metrics may take a while.