Free Access
Fig. 1
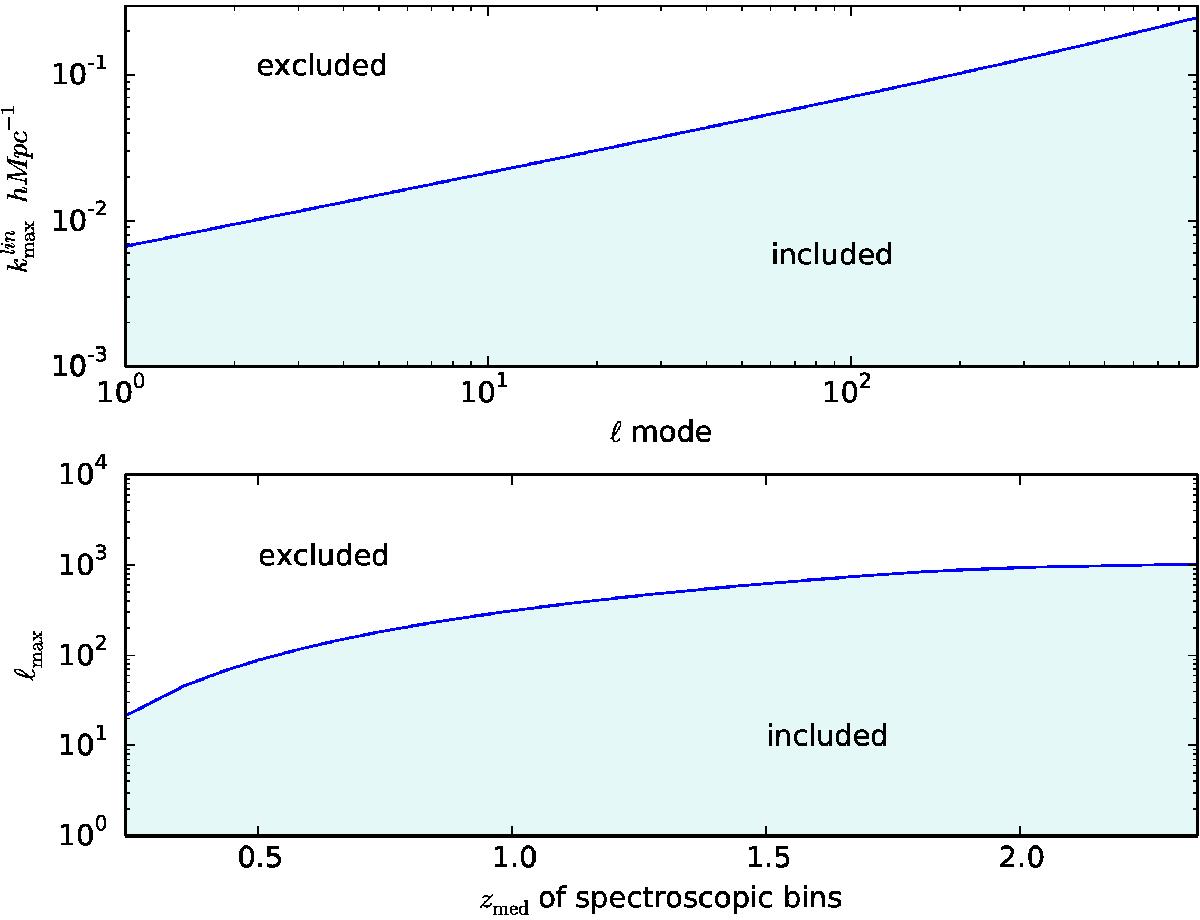
Top: linear-scale limit in k for the SFB power spectra as a function of angular modes. Bottom: linear-scale limit ℓmax for the tomographic power spectra ![]() as a function of the lowest median redshift of the spectroscopic bins i and j. The regions above the lines are excluded from the Fisher analysis.
as a function of the lowest median redshift of the spectroscopic bins i and j. The regions above the lines are excluded from the Fisher analysis.
Current usage metrics show cumulative count of Article Views (full-text article views including HTML views, PDF and ePub downloads, according to the available data) and Abstracts Views on Vision4Press platform.
Data correspond to usage on the plateform after 2015. The current usage metrics is available 48-96 hours after online publication and is updated daily on week days.
Initial download of the metrics may take a while.