Free Access
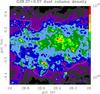
Fig. 6
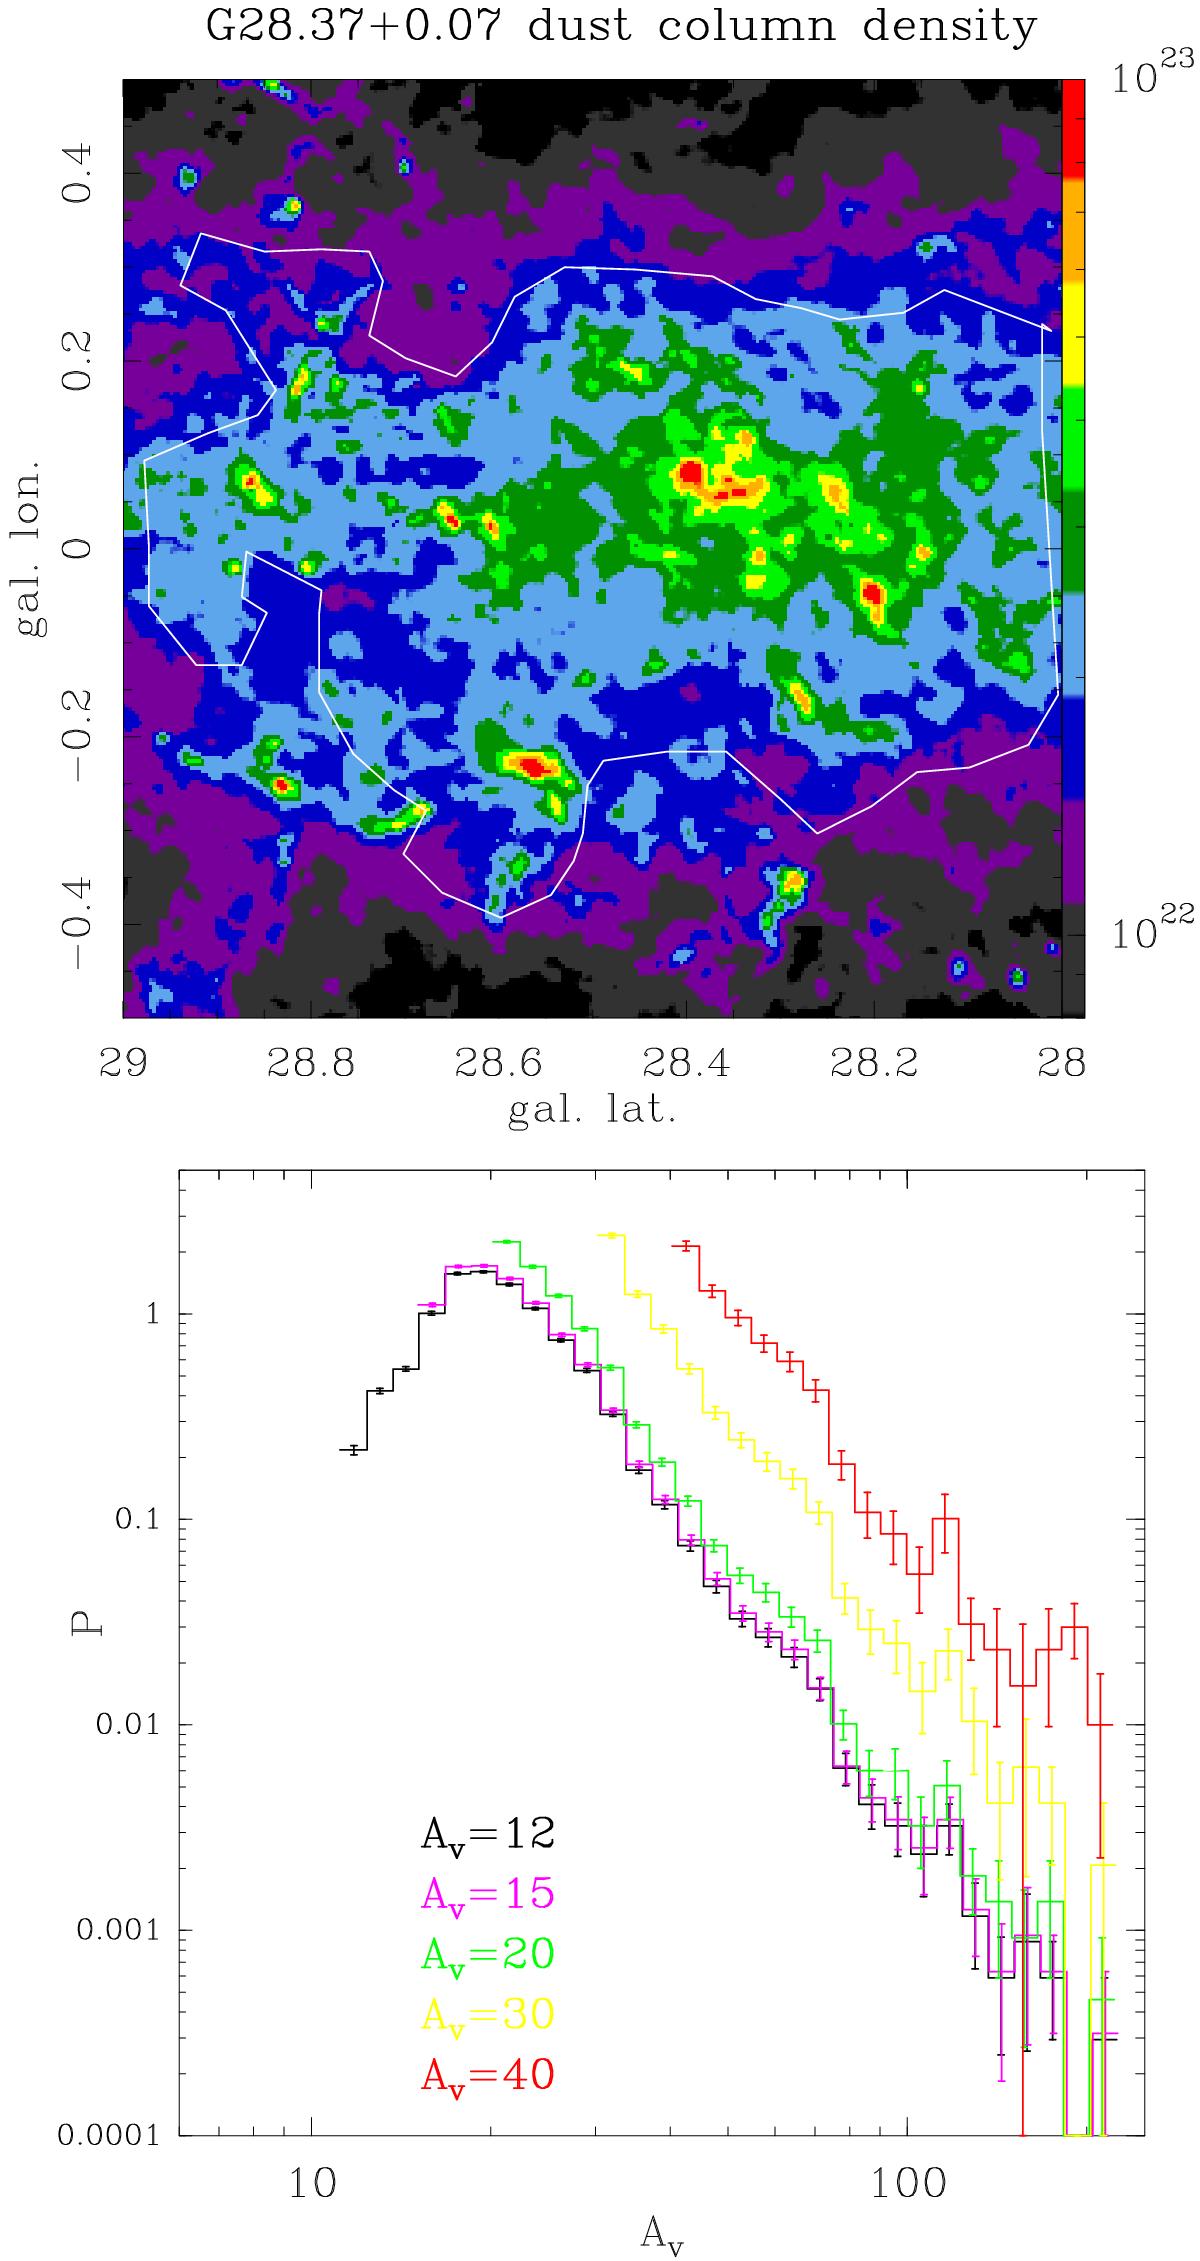
Top: H2 column density from dust continuum with the white contour, roughly outlining the GMC in which G28.37+0.07 is embedded. Bottom: PDFs of the GMC, derived from the dust column density map from the left above different Av-thresholds (indicated with different colours and given in the panel).
This figure is made of several images, please see below:
Current usage metrics show cumulative count of Article Views (full-text article views including HTML views, PDF and ePub downloads, according to the available data) and Abstracts Views on Vision4Press platform.
Data correspond to usage on the plateform after 2015. The current usage metrics is available 48-96 hours after online publication and is updated daily on week days.
Initial download of the metrics may take a while.