Fig. B.1
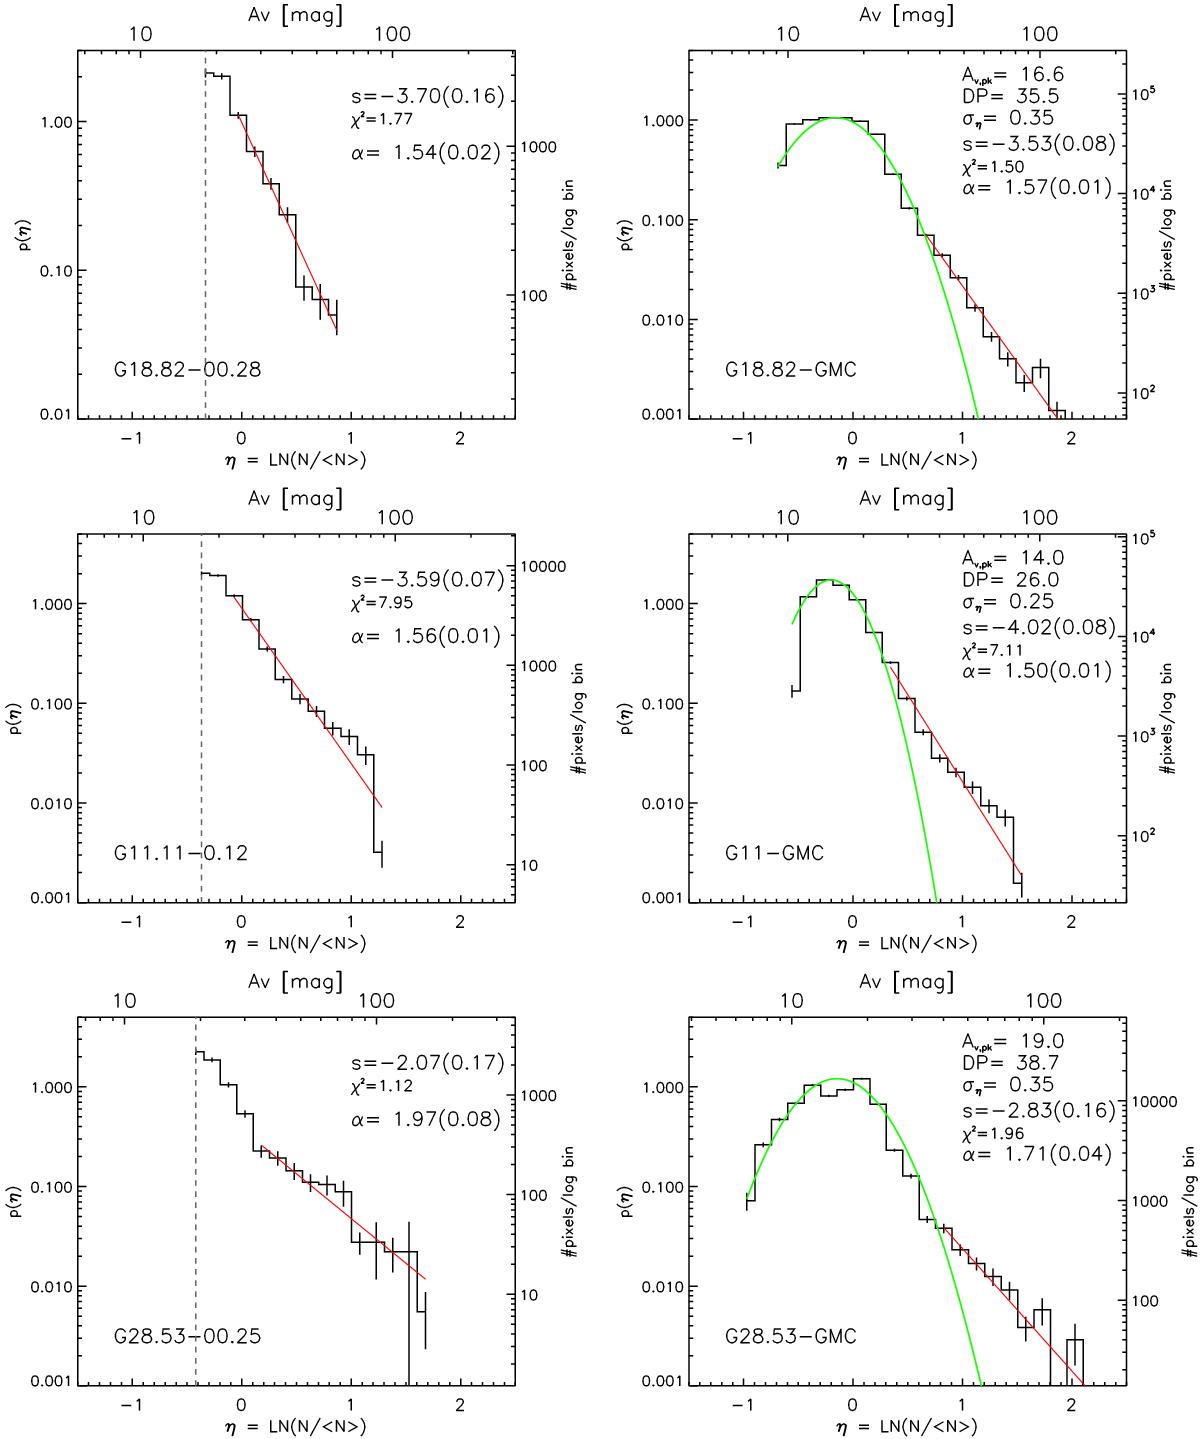
PDFs derived from Herschel column density maps (SED fit using only the Herschel wavelengths 160, 250, 350, and 500 μm) at 36′′ angular resolution. Left panel shows the PDFs of pixels comprising only the IRDC i.e. G18.82-0.28 (Cloud A), G28.53-0.25 (Cloud D), and G11.11-0.12. Right panel shows PDFs from associated GMC, including the IRDC. The left y-axis gives the normalised probability p(η), the right y-axis the number of pixels per log bin. The upper x-axis is the visual extinction and the lower x-axis the logarithm of the normalised column density. The dashed vertical line indicates the completeness level. The red line indicates a power-law fit to the high column density tail with the slope s together with its error and the reduced X2 goodness-of-fit. The exponent α of an equivalent spherical density distribution ρ(r) ∝ r− α is also indicated in the panel. The dashed line in the upper panel indicates the completeness level; the PDF left of this line is incomplete.
Current usage metrics show cumulative count of Article Views (full-text article views including HTML views, PDF and ePub downloads, according to the available data) and Abstracts Views on Vision4Press platform.
Data correspond to usage on the plateform after 2015. The current usage metrics is available 48-96 hours after online publication and is updated daily on week days.
Initial download of the metrics may take a while.