Fig. 5
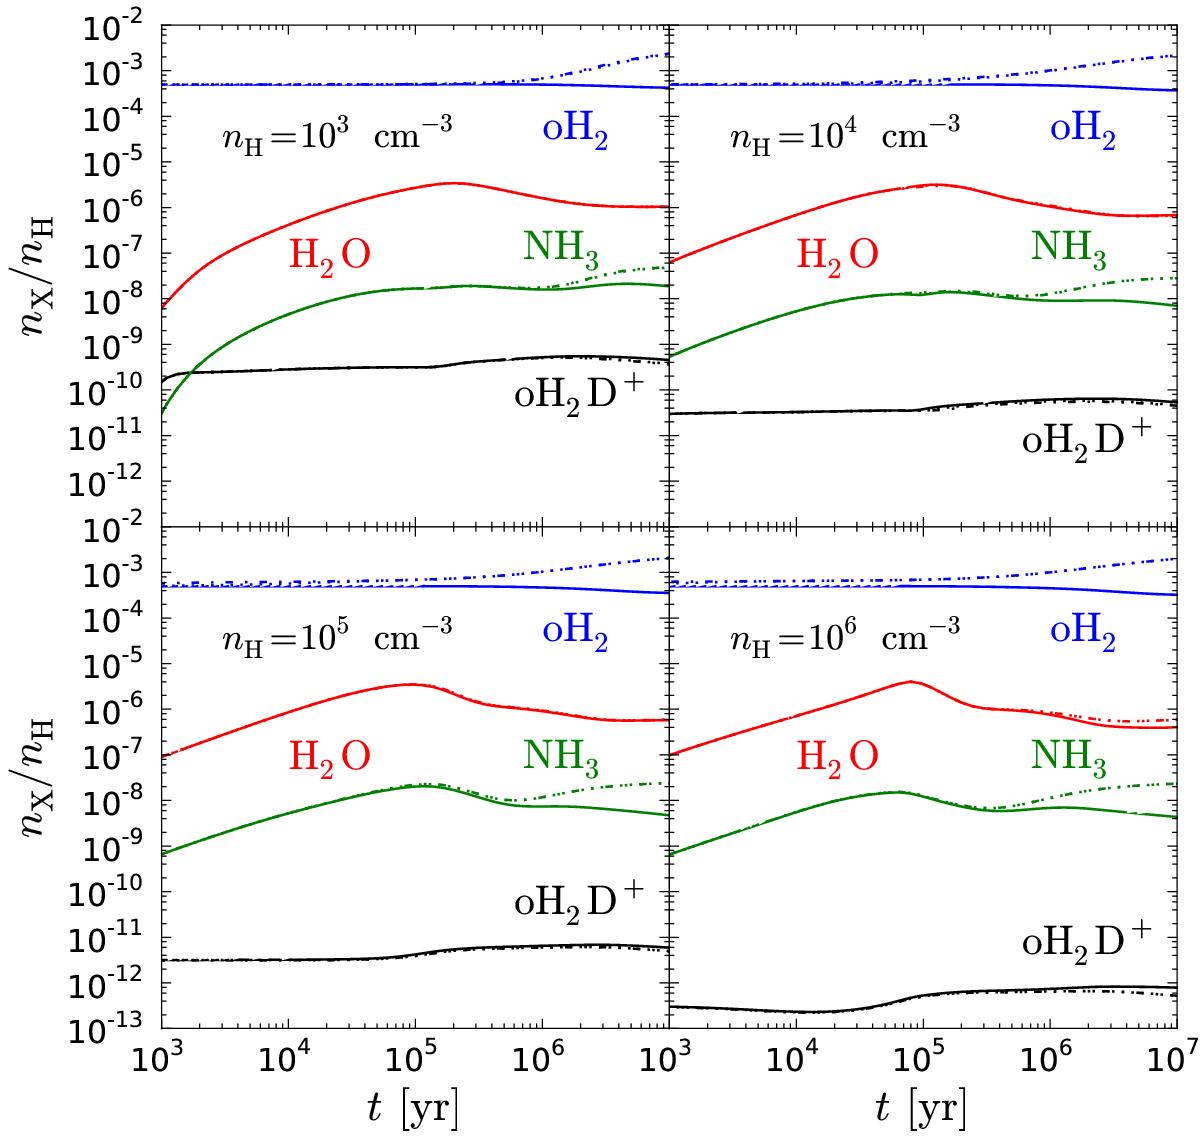
Abundances of selected species as functions of time at different densities (labeled in the figure), in a gas-phase model at T = 10 K, using different approaches to H2 formation. Dash-dotted lines correspond to the gas-phase reactions of Kong et al. (2013). Solid lines correspond to grain-surface H2 formation assuming only H and D adsorption and with the binding energies of H and H2 and their deuterated isotopologs set to 100 K. Dotted lines (superimposed on the dash-dotted lines) correspond to grain-surface H2 formation assuming only H and D adsorption and with the binding energies adopted in the main body of this work. The abundances of ammonia, water and H2D+ represent sums over the abundances of their respective ortho and para states.
Current usage metrics show cumulative count of Article Views (full-text article views including HTML views, PDF and ePub downloads, according to the available data) and Abstracts Views on Vision4Press platform.
Data correspond to usage on the plateform after 2015. The current usage metrics is available 48-96 hours after online publication and is updated daily on week days.
Initial download of the metrics may take a while.