Fig. 8
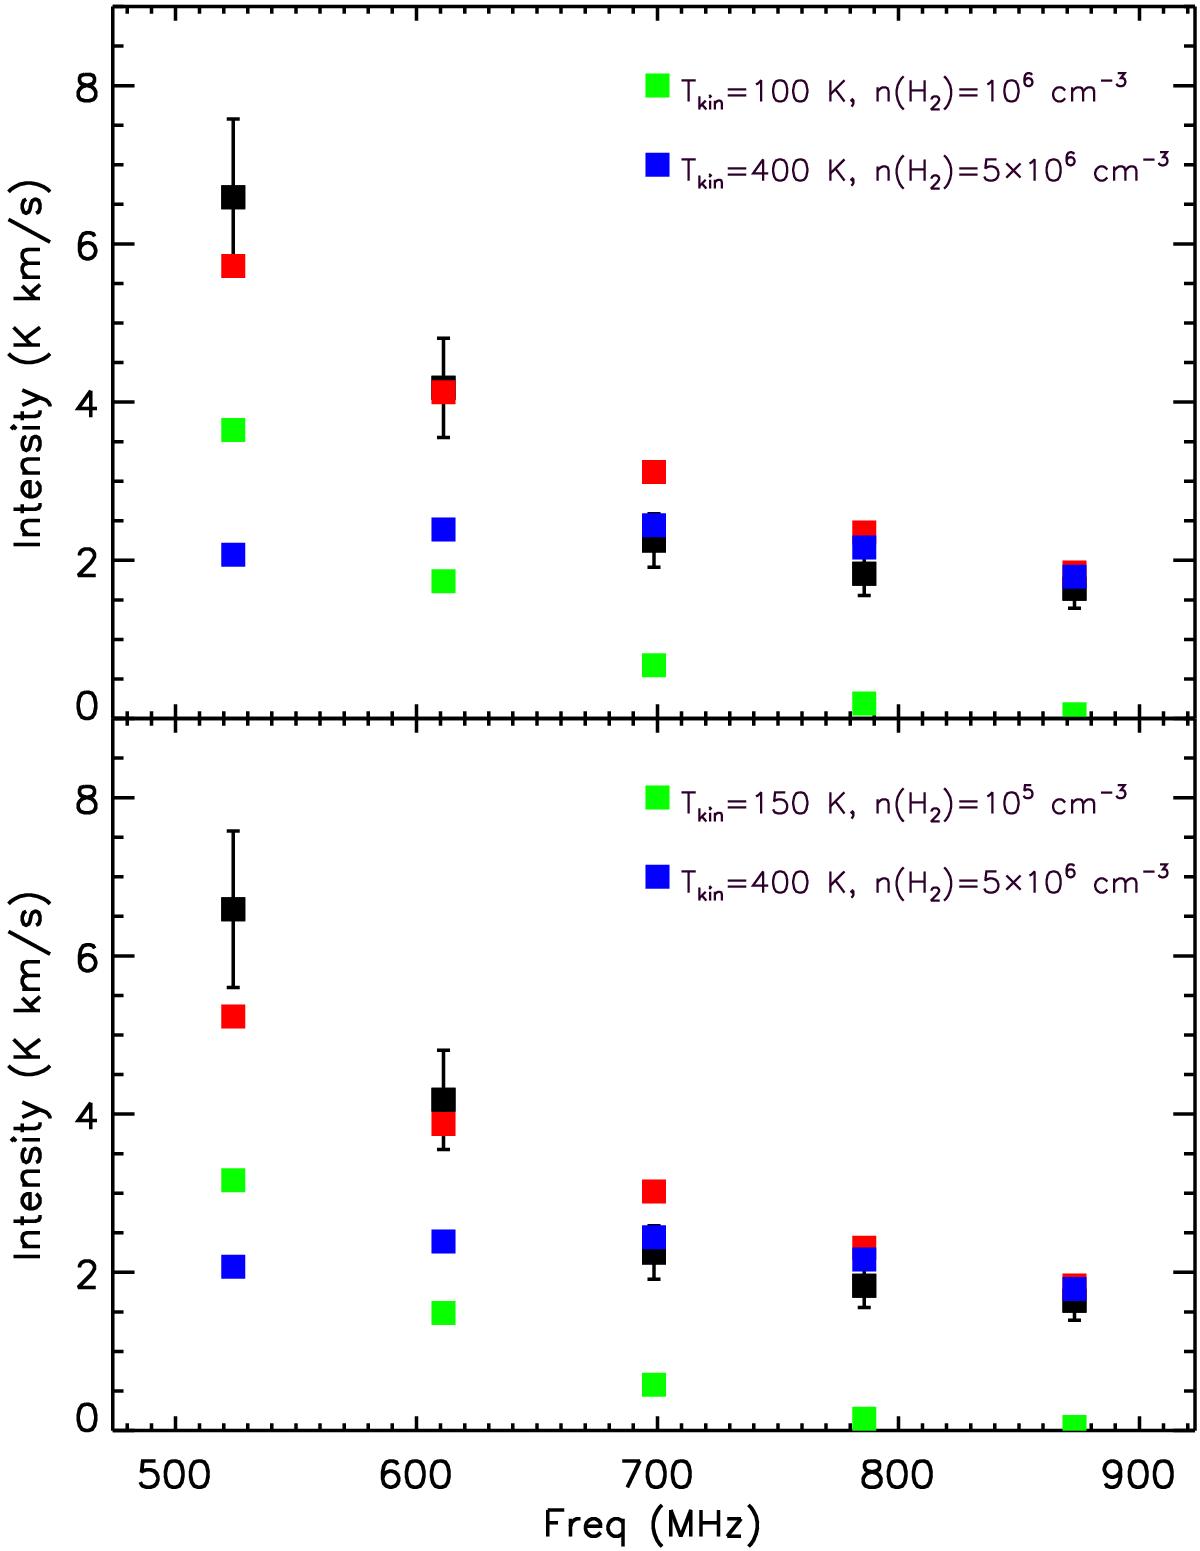
Non-LTE C2H line intensity predictions with RADEX vs. the observed line intensities (black symbols). Top panel: the models correspond to parameters of n(H2) = 106 cm-3, Tkin = 100 K, N(C2H) = 8 × 1013 cm-2 (green symbols), and to n(H2) = 5 × 106 cm-3, Tkin = 400 K, N(C2H) = 2 × 1013 cm-2 (blue symbols). The sum of the two components is given by the red symbols. Bottom panel: the models correspond to parameters of n(H2) = 105 cm-3, Tkin = 150 K, N(C2H) = 8 × 1013 cm-2 (green symbols), and to n(H2) = 5 × 106 cm-3, Tkin = 400 K, N(C2H) = 2 × 1013 cm-2 (blue symbols). The sum of the two components is given by the red symbols.
Current usage metrics show cumulative count of Article Views (full-text article views including HTML views, PDF and ePub downloads, according to the available data) and Abstracts Views on Vision4Press platform.
Data correspond to usage on the plateform after 2015. The current usage metrics is available 48-96 hours after online publication and is updated daily on week days.
Initial download of the metrics may take a while.