Fig. B.2
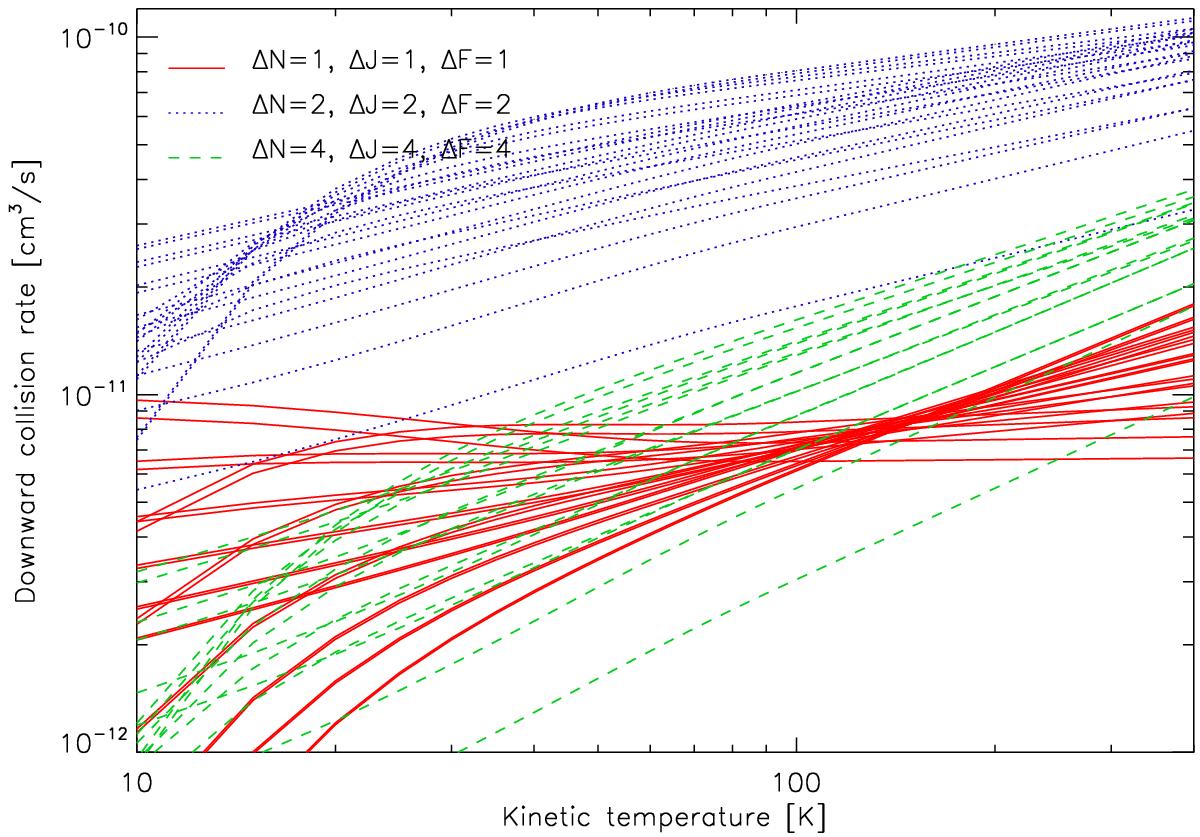
Temperature dependence for the main collision rates of C2H with H2. The curves are sorted by ΔJ but cover all transitions of the corresponding series. Every connected dot in Fig. B.1 produces one temperature-dependence graph in this plot. To improve the readability, we have omitted the ΔN = ΔJ = ΔF = 3 series here. Up to 100 K, the lines show the rates computed by Spielfiedel et al. (2012), from 100 to 400 K, and we extrapolated as a power law with the same slope as measured between 90 and 100 K.
Current usage metrics show cumulative count of Article Views (full-text article views including HTML views, PDF and ePub downloads, according to the available data) and Abstracts Views on Vision4Press platform.
Data correspond to usage on the plateform after 2015. The current usage metrics is available 48-96 hours after online publication and is updated daily on week days.
Initial download of the metrics may take a while.