Fig. B.1
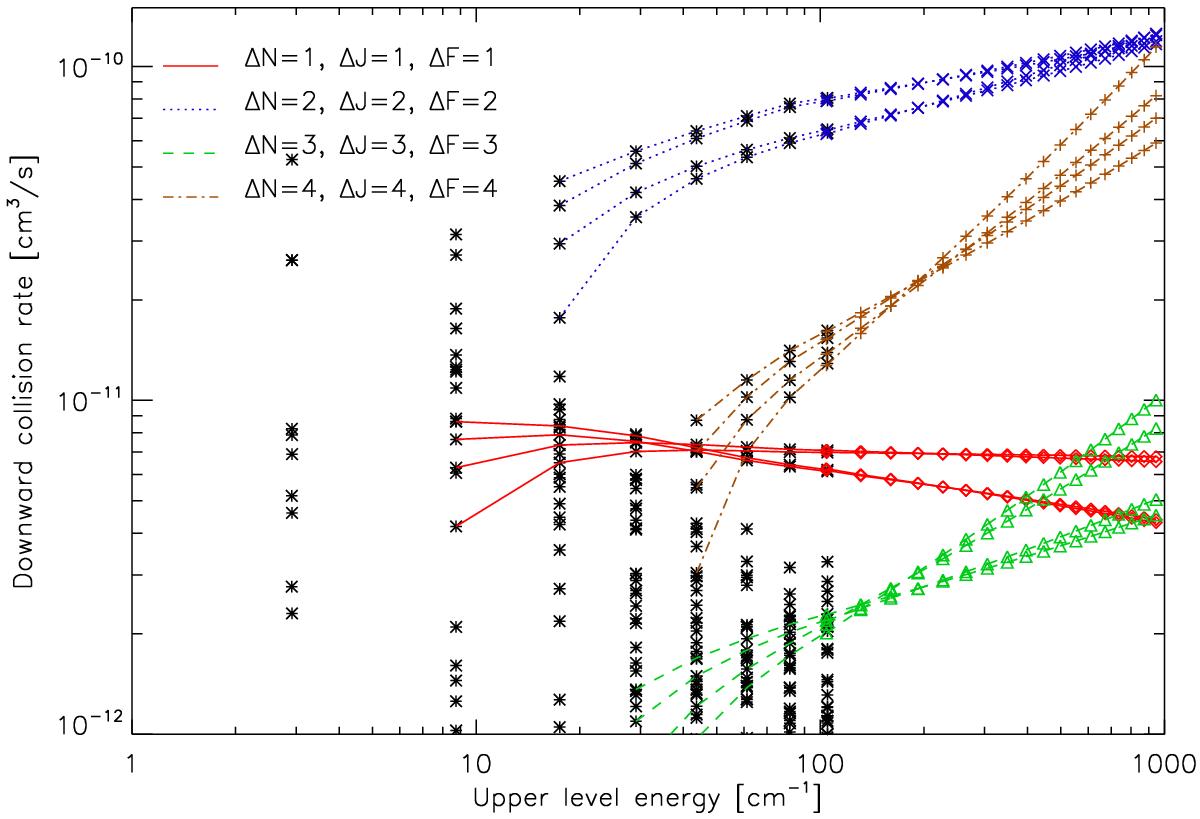
Rates for the de-excitation of C2H through collision with H2 at 100 K. Black crosses mark all collision rates from Spielfiedel et al. (2012) above 10-12 cm3s-1. The curves indicate the different transition series for pure rotational transitions of the molecule, i.e., ΔN = ΔJ = ΔF. Each series consists of four curves according to the fine and hyperfine structure split of the four N states with approximately the same energy: J = N ± /1/2 and F = J ± 1/2. The continuations of those curves into the colored symbols show the extrapolation of the rates to the higher level transitions using the formalism from Schöier et al. (2005) based on the IOS approximation.
Current usage metrics show cumulative count of Article Views (full-text article views including HTML views, PDF and ePub downloads, according to the available data) and Abstracts Views on Vision4Press platform.
Data correspond to usage on the plateform after 2015. The current usage metrics is available 48-96 hours after online publication and is updated daily on week days.
Initial download of the metrics may take a while.