Free Access
Fig. 4
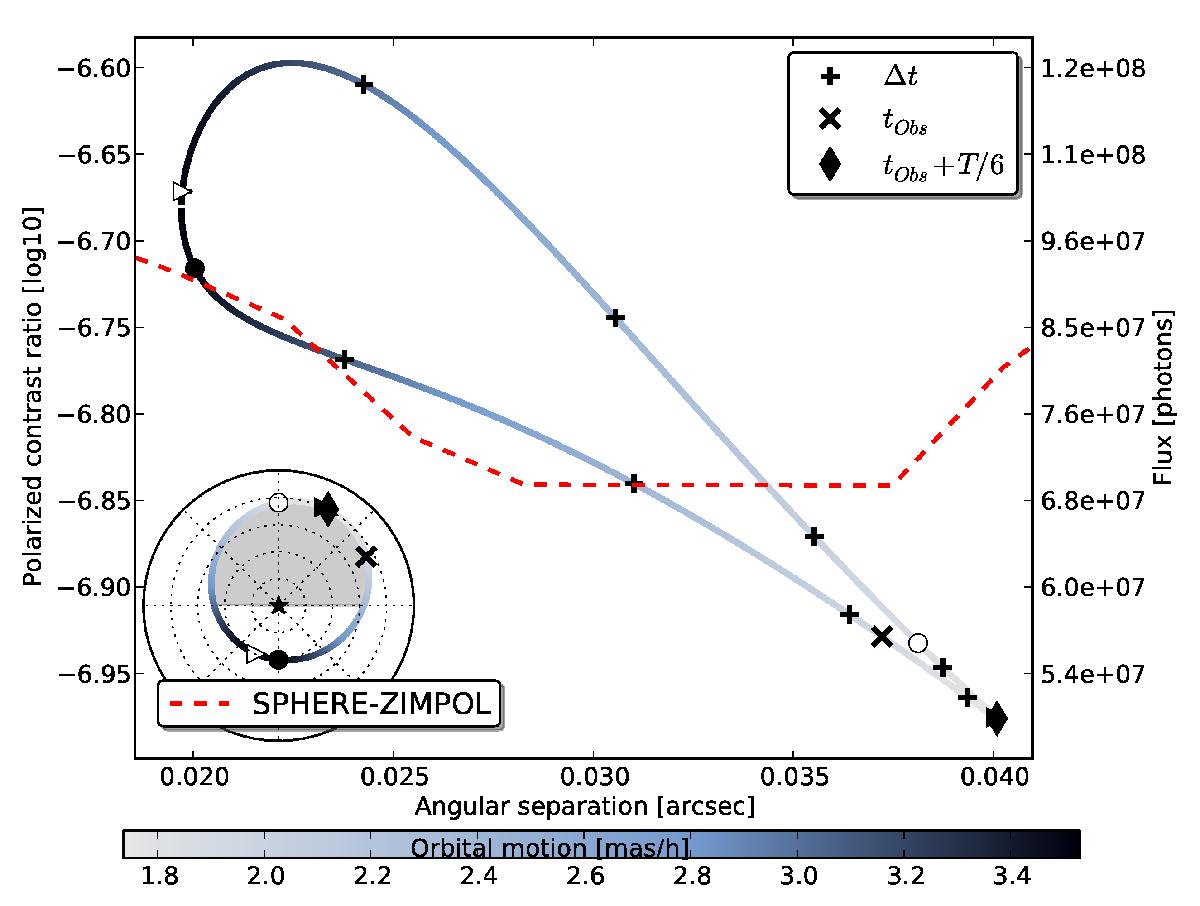
Same caption as Fig. 3 except that it represents the apparent orbital motion in mas per hour as gray scale, plotted against the angular separation and the polarized contrast ratio axes. The red dotted line corresponds to the SPHERE-ZIMPOL performance for 1 h exposure (observability domain being above the line).
Current usage metrics show cumulative count of Article Views (full-text article views including HTML views, PDF and ePub downloads, according to the available data) and Abstracts Views on Vision4Press platform.
Data correspond to usage on the plateform after 2015. The current usage metrics is available 48-96 hours after online publication and is updated daily on week days.
Initial download of the metrics may take a while.