Fig. 3
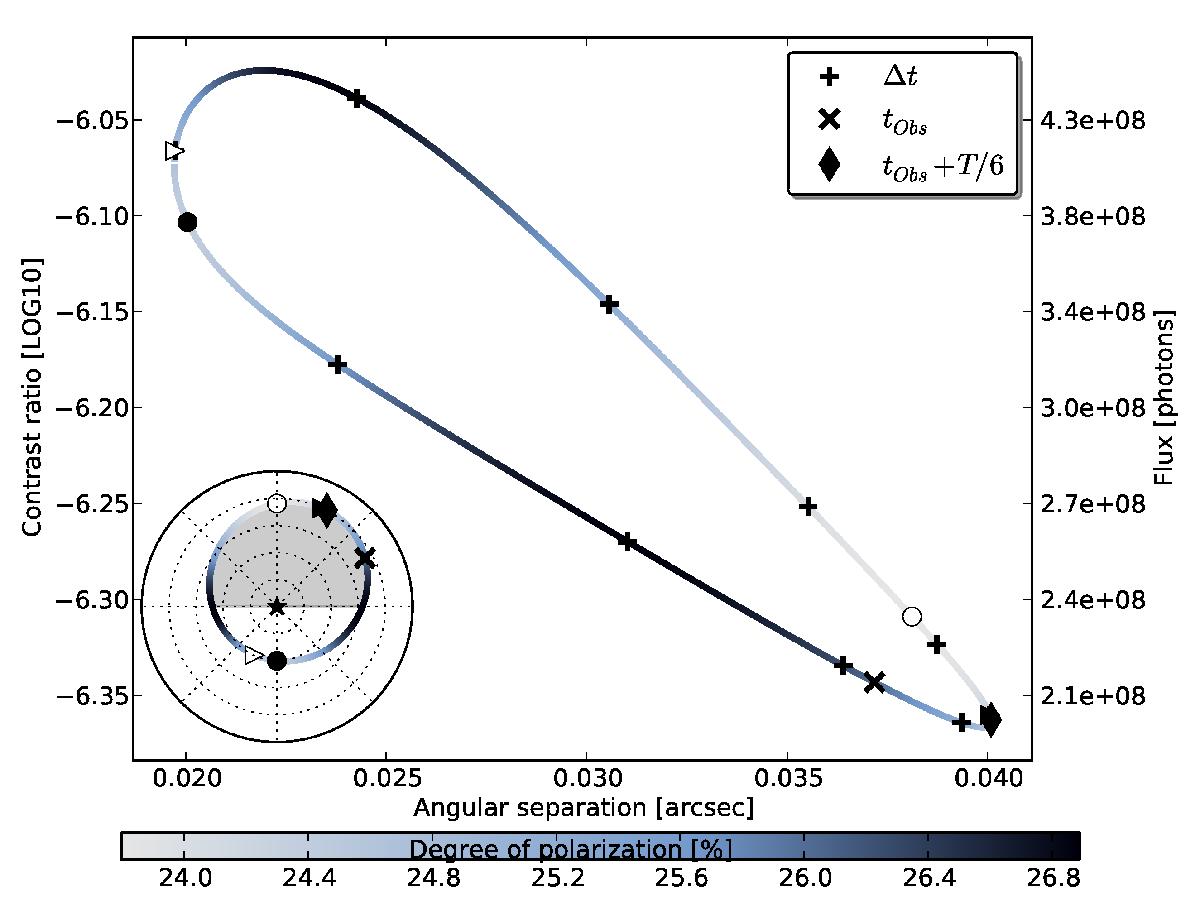
SPOC diagram for Cenα,0.34 with i = 15°, see Table 4, assumed to be Venus-like regarding its reflectance parameters. It represents the polarization values as gray scale, plotted against the angular separation and the contrast ratio axes. The exoplanet’s orbit is therefore displayed in a separation-contrast phase diagram. The wavelength is the V-band. The “x” indicates the position of the exoplanet at an arbitrary observation time. The diamond indicates the position of the planet one sixth of the orbital period T later (giving the forward direction of time). The 10 plus signs indicate the evolution of the planet along the curve; they are linearly spaced in time. The empty and filled triangles are periapsis and apoapsis: rmin = 0.026 AU and rmax = 0.054 AU. The empty and filled circles are minimum and maximum phase angle: αmin = 75° and αmax = 105°. The bottom left panel shows the orbit as seen by the observer, where the shaded area corresponds to the portion of the orbit that is behind the plane of the paper. The dashed lined corresponds to the limit of the same instrument sensitivities as in the preceding example. The right-hand side y-axis is given in photons per VLT collecting area per hour integrated over V-band. Two successive plus signs correspond to 7h46min.
Current usage metrics show cumulative count of Article Views (full-text article views including HTML views, PDF and ePub downloads, according to the available data) and Abstracts Views on Vision4Press platform.
Data correspond to usage on the plateform after 2015. The current usage metrics is available 48-96 hours after online publication and is updated daily on week days.
Initial download of the metrics may take a while.