Fig. 4
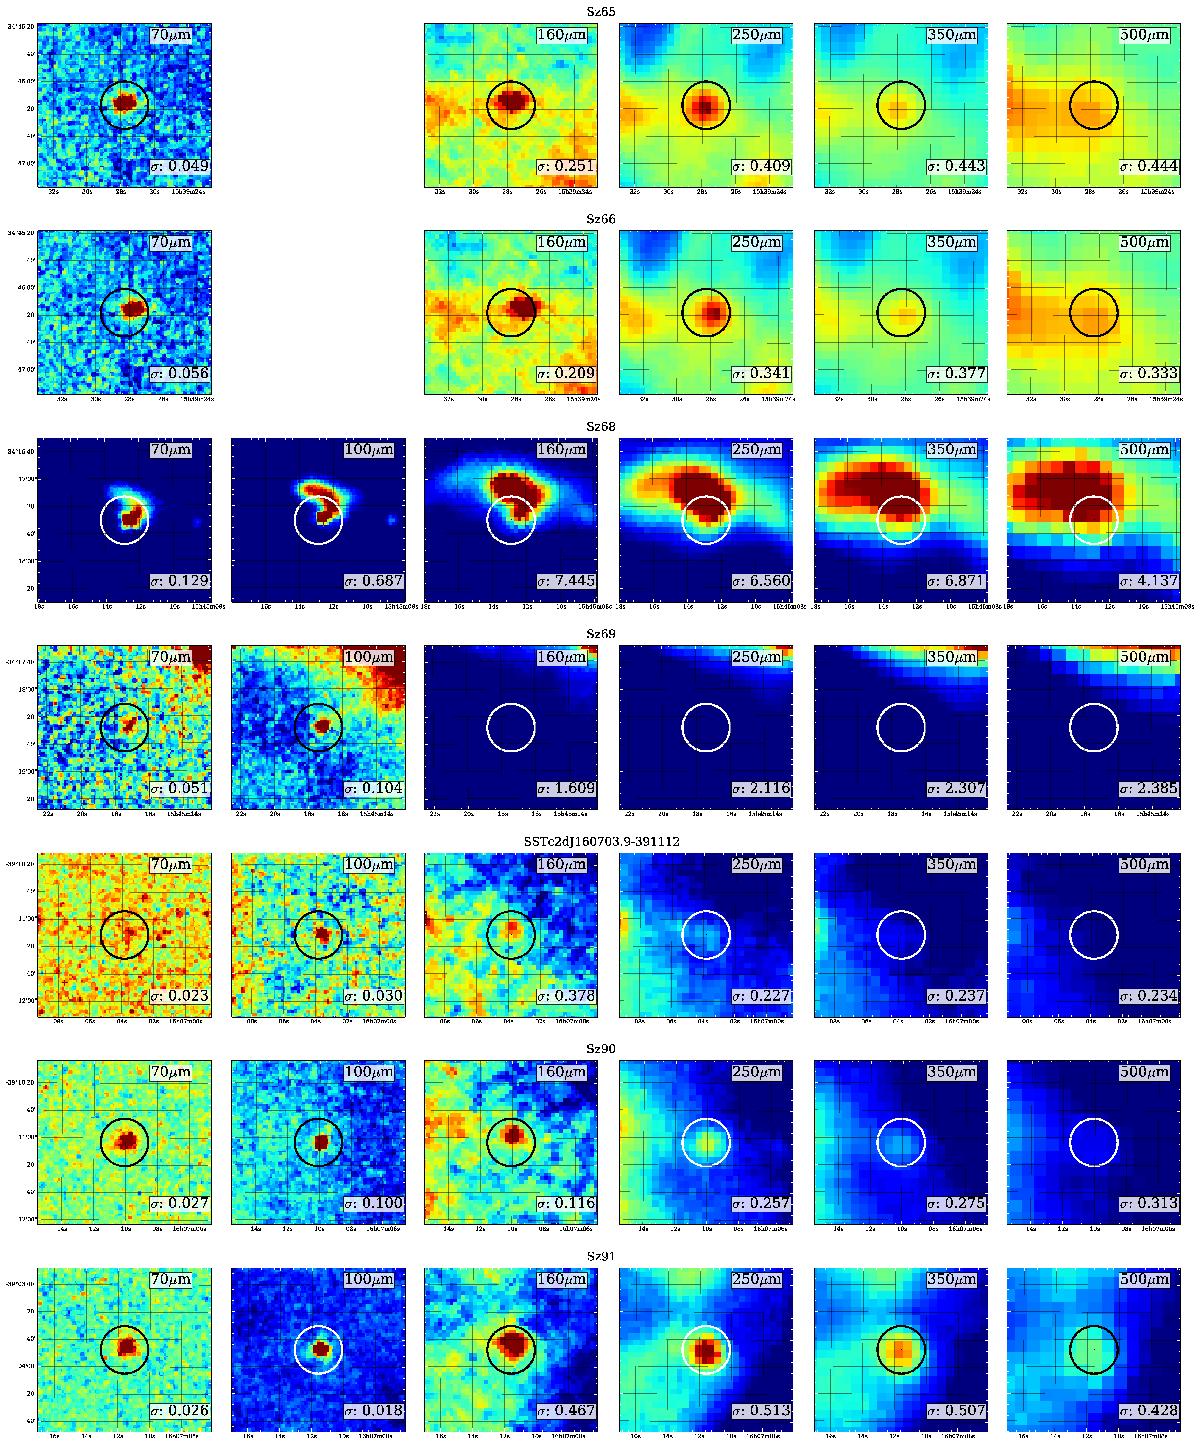
Images of each of the 34 sources with at least one point source detected by Herschel, plus object 2MASSJ1608537, added for completeness. The images correspond to a box of 120′′ × 120′′ in size. Coordinates are given in Table 5. The color scale is defined with the root-mean square of the pixel values (as background level) and this number plus three times the standard deviation (as maximum level). North is up and east is left. A circle indicates the expected position of the target. The standard deviation computed around the sources is shown for each image (bottom right).
Current usage metrics show cumulative count of Article Views (full-text article views including HTML views, PDF and ePub downloads, according to the available data) and Abstracts Views on Vision4Press platform.
Data correspond to usage on the plateform after 2015. The current usage metrics is available 48-96 hours after online publication and is updated daily on week days.
Initial download of the metrics may take a while.