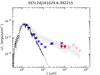
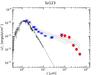
Fig. 2
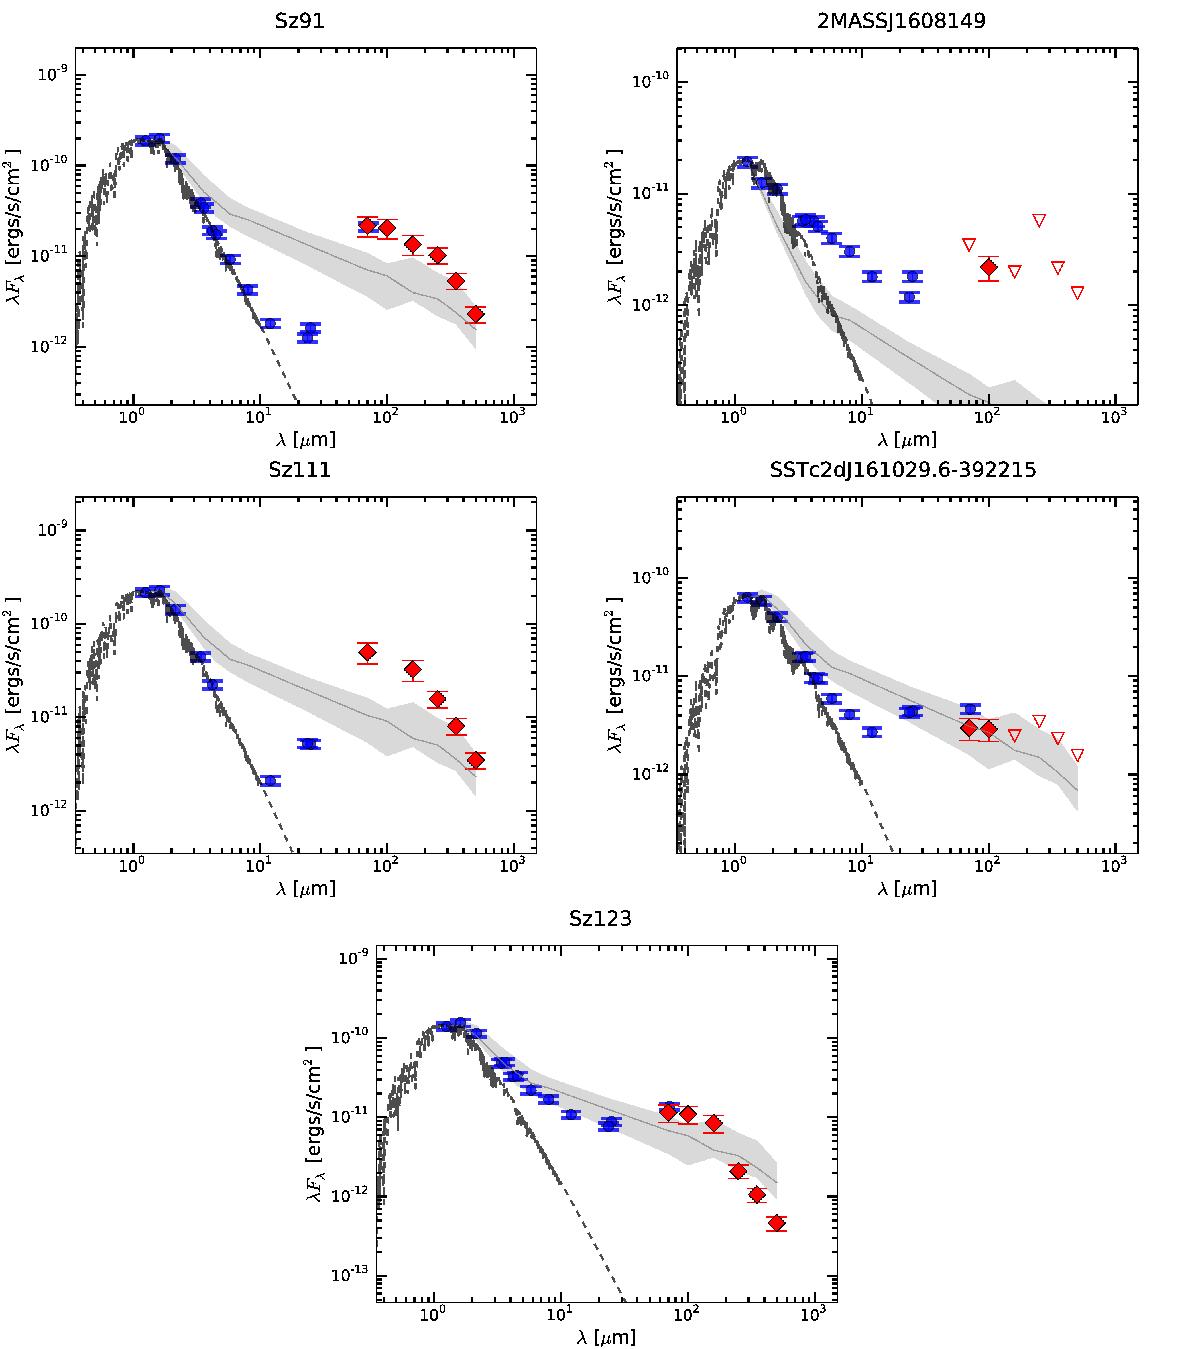
SEDs of the five transitional disk candidates identified with Herschel. Blue dots represent the dereddened ancillary data from the literature from previous studies. The red diamonds are the clear detections with Herschel, and the red triangles the upper limits wherever no clear detection in the maps was found. The gray solid line is the median SED from the Lupus sample of the 29 non-transitional disks in the region, and the gray shaded area the first and fourth quartiles. See Table 7 for more information. The dashed lines are the photospheric NextGen models from Allard et al. (2012).
Current usage metrics show cumulative count of Article Views (full-text article views including HTML views, PDF and ePub downloads, according to the available data) and Abstracts Views on Vision4Press platform.
Data correspond to usage on the plateform after 2015. The current usage metrics is available 48-96 hours after online publication and is updated daily on week days.
Initial download of the metrics may take a while.