Free Access
Fig. 9
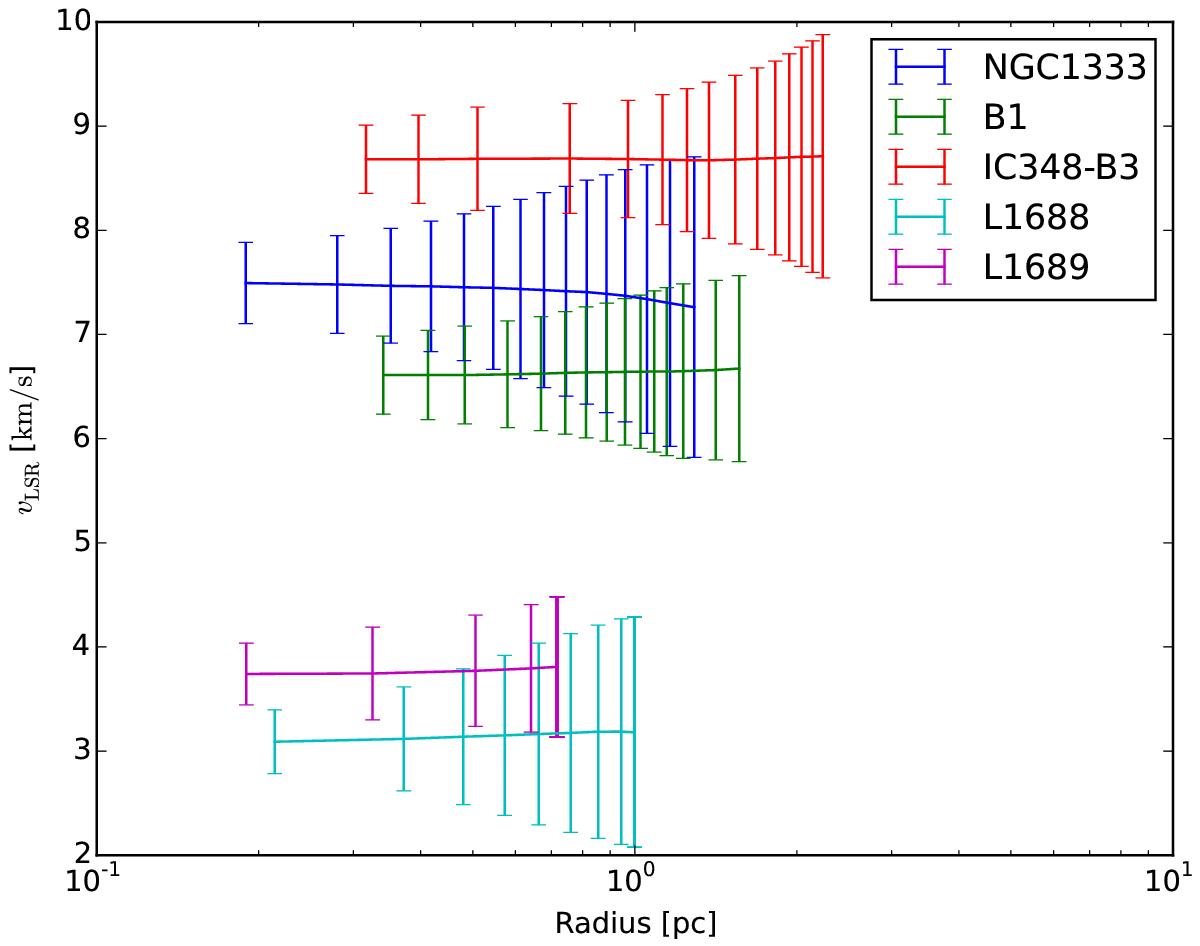
Dependence of velocity and velocity dispersion as a function of radius. Here the solid lines represent the velocities of the regions, and the bars represent the velocity dispersions of the regions at given radii. The vertical extent of the errorbars are the 3D velocity dispersion ![]() .
.
Current usage metrics show cumulative count of Article Views (full-text article views including HTML views, PDF and ePub downloads, according to the available data) and Abstracts Views on Vision4Press platform.
Data correspond to usage on the plateform after 2015. The current usage metrics is available 48-96 hours after online publication and is updated daily on week days.
Initial download of the metrics may take a while.