Fig. 8
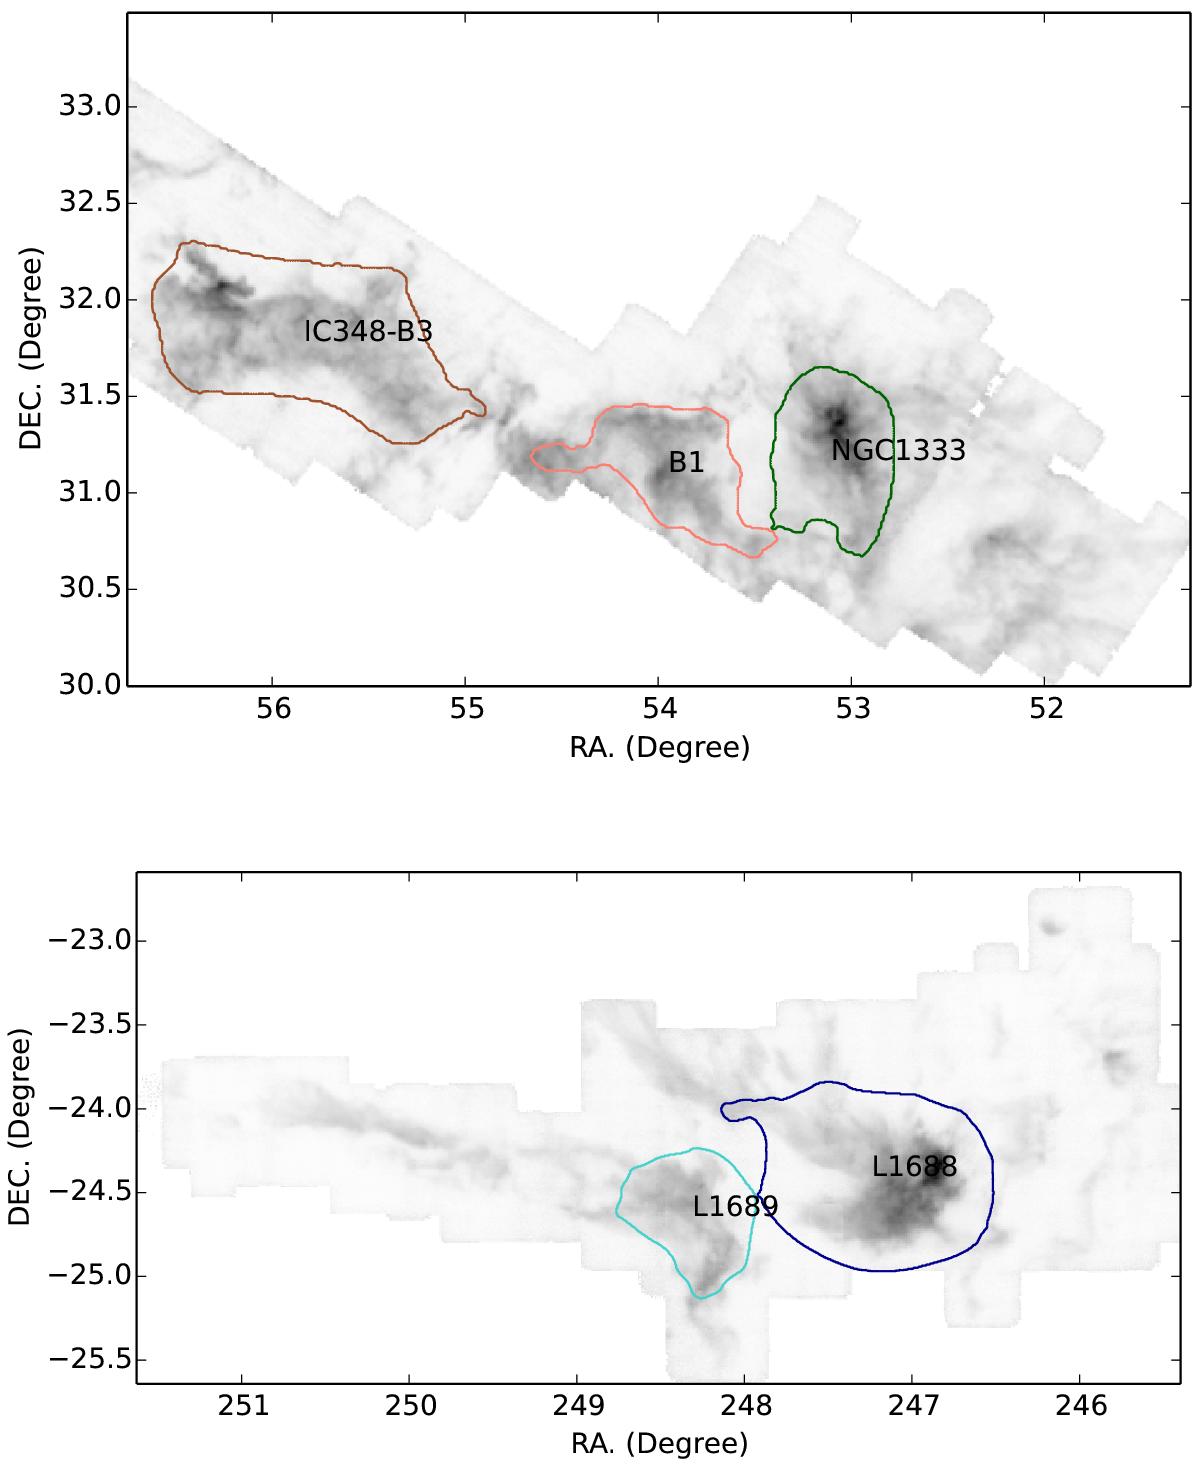
Regions identified by applying the dendrogram algorithm to our G-virial map. The results from the Perseus molecular cloud (upper panel) and Ophiuchus molecular cloud (lower panel) are presented. The grayscale images correspond to the velocity-integrated 13CO(1–0) emission and the contours correspond to the projected boundaries of the identified regions. These regions correspond to the “leaves” of the dendrogram. The conventional names of the regions are labeled.
Current usage metrics show cumulative count of Article Views (full-text article views including HTML views, PDF and ePub downloads, according to the available data) and Abstracts Views on Vision4Press platform.
Data correspond to usage on the plateform after 2015. The current usage metrics is available 48-96 hours after online publication and is updated daily on week days.
Initial download of the metrics may take a while.