Fig. 4
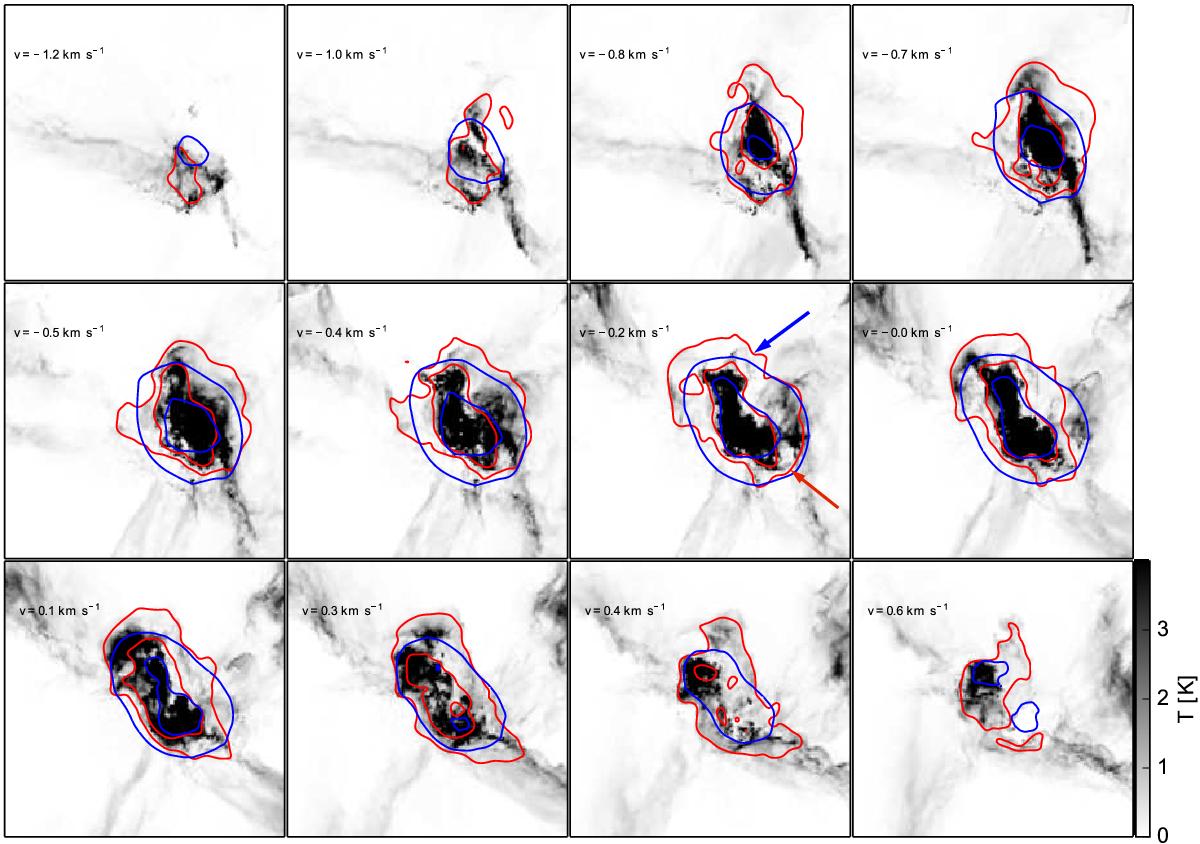
Comparison between between G-virialmodel and G-virialreconstructed in the PPV space for the hydrodynamical model described in Sect. 5.2. In the model, turbulence is injected through compressible forcing, and no self-gravity is included (Federrath et al. 2008). The G-virialmodel in the PPV space is defined as the mass-weighted average of the G-virialmodel in the PPP space, which is defined in 12. Here, the grayscale image is the simulated 13CO(1–0) emission from the model. The red contours stand for the G-virialmodel, and the contour levels are (6, 5, 10). The blue contours stand for the G-virialreconstructed, and the contour levels are (3, 6). It worth noting that the G-virialmodel and the G-virialreconstructed agrees better at regions where mass is traced. This can be seen in the v = −0.2 km s-1 channel. They agree better at the regions where mass is traced (e.g., the red arrow), but does not agree well at the region without mass (e.g., the blue arrow).
Current usage metrics show cumulative count of Article Views (full-text article views including HTML views, PDF and ePub downloads, according to the available data) and Abstracts Views on Vision4Press platform.
Data correspond to usage on the plateform after 2015. The current usage metrics is available 48-96 hours after online publication and is updated daily on week days.
Initial download of the metrics may take a while.