Fig. 3
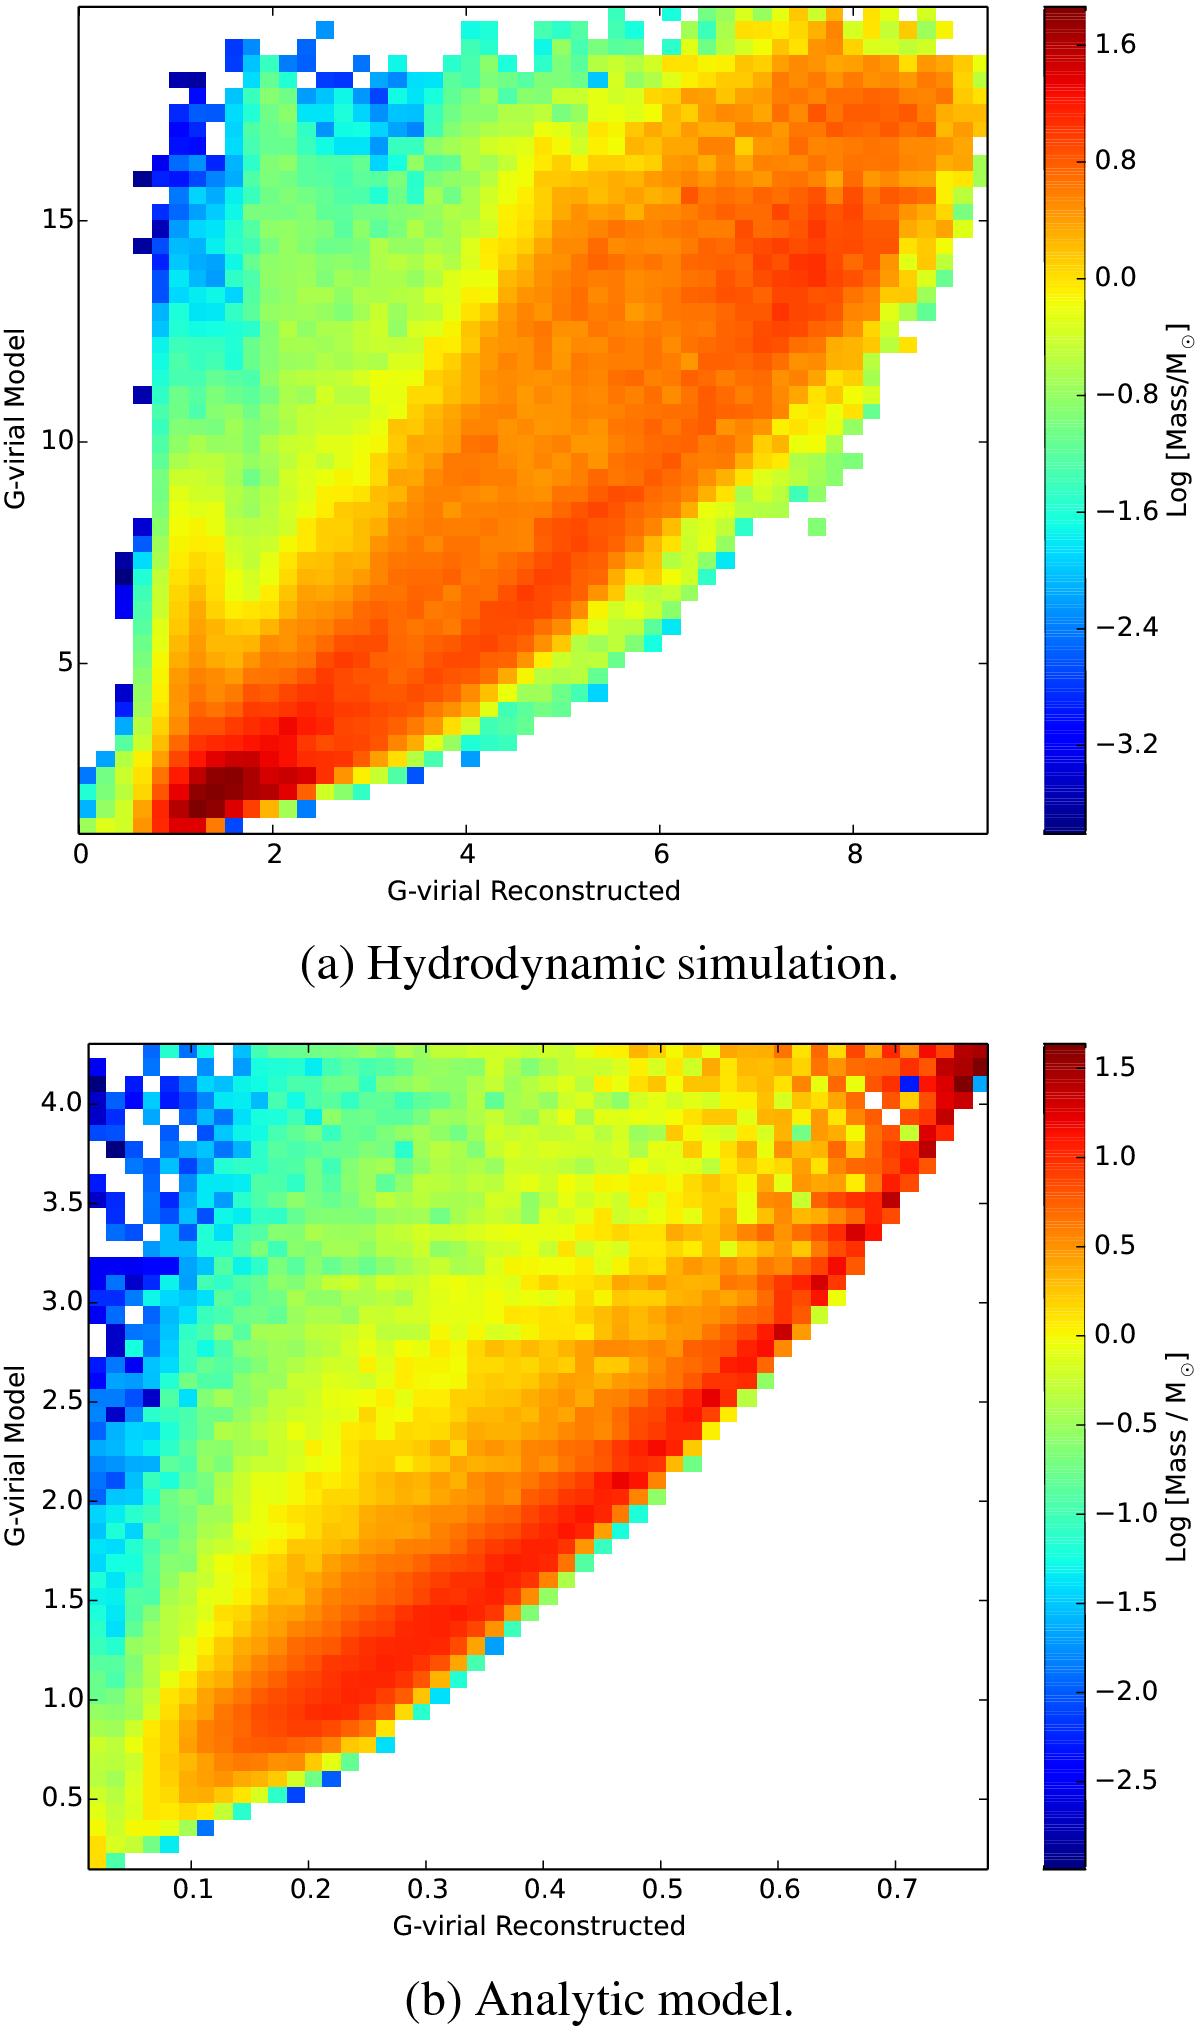
Comparison between the G-virialmodel calculated from the model and the G-virialreconstructed, which is reconstructed from the simulated observations in the PPV space. Panel a) shows the result for the hydrodynamic simulation; and panel b) shows the result for the analytical model with γρ = −2.2 and γv = 0.5. The colors stand for the amount of mass in a given interval.
Current usage metrics show cumulative count of Article Views (full-text article views including HTML views, PDF and ePub downloads, according to the available data) and Abstracts Views on Vision4Press platform.
Data correspond to usage on the plateform after 2015. The current usage metrics is available 48-96 hours after online publication and is updated daily on week days.
Initial download of the metrics may take a while.