Fig. C.1
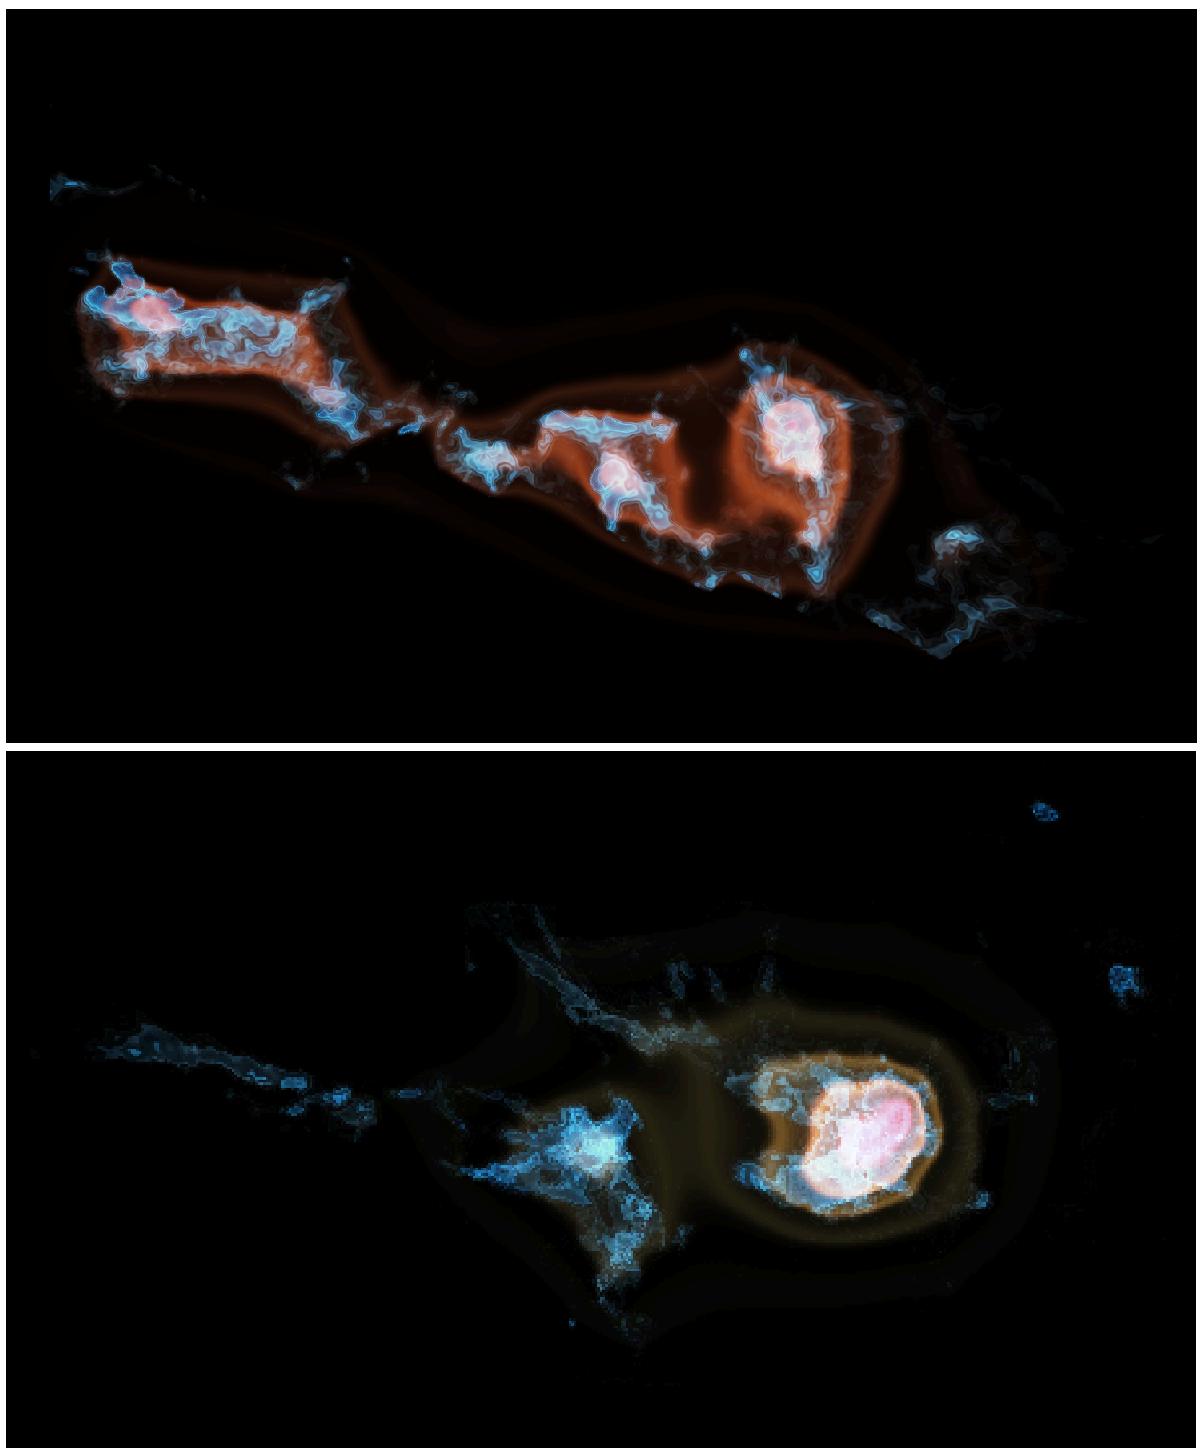
Volume rending representations of the 13CO(1–0) emission and the corresponding G-virial map. The upper panel shows the result from the Perseus molecular cloud and the lower panel shows the result from the Ophiuchus molecular cloud. Blue stands for 13CO(1–0) emission and red and orange stand for G-virial. Both clouds are projected along the velocity direction. For the Perseus molecular cloud, the iso-surfaces of 13CO(1–0) emission start from 0.3 K and increase in steps of 0.64 K. The contours of the G-virial starts from 1.2 and increase in steps of 0.8. For the Ophiuchus molecular cloud, the contours of 13CO(1–0) emission start from 0.3 K and increase in steps of 1.24 K. The contours of the G-virial starts from 1.2 and increase in steps of 0.8.
Current usage metrics show cumulative count of Article Views (full-text article views including HTML views, PDF and ePub downloads, according to the available data) and Abstracts Views on Vision4Press platform.
Data correspond to usage on the plateform after 2015. The current usage metrics is available 48-96 hours after online publication and is updated daily on week days.
Initial download of the metrics may take a while.