Free Access
Fig. B.1
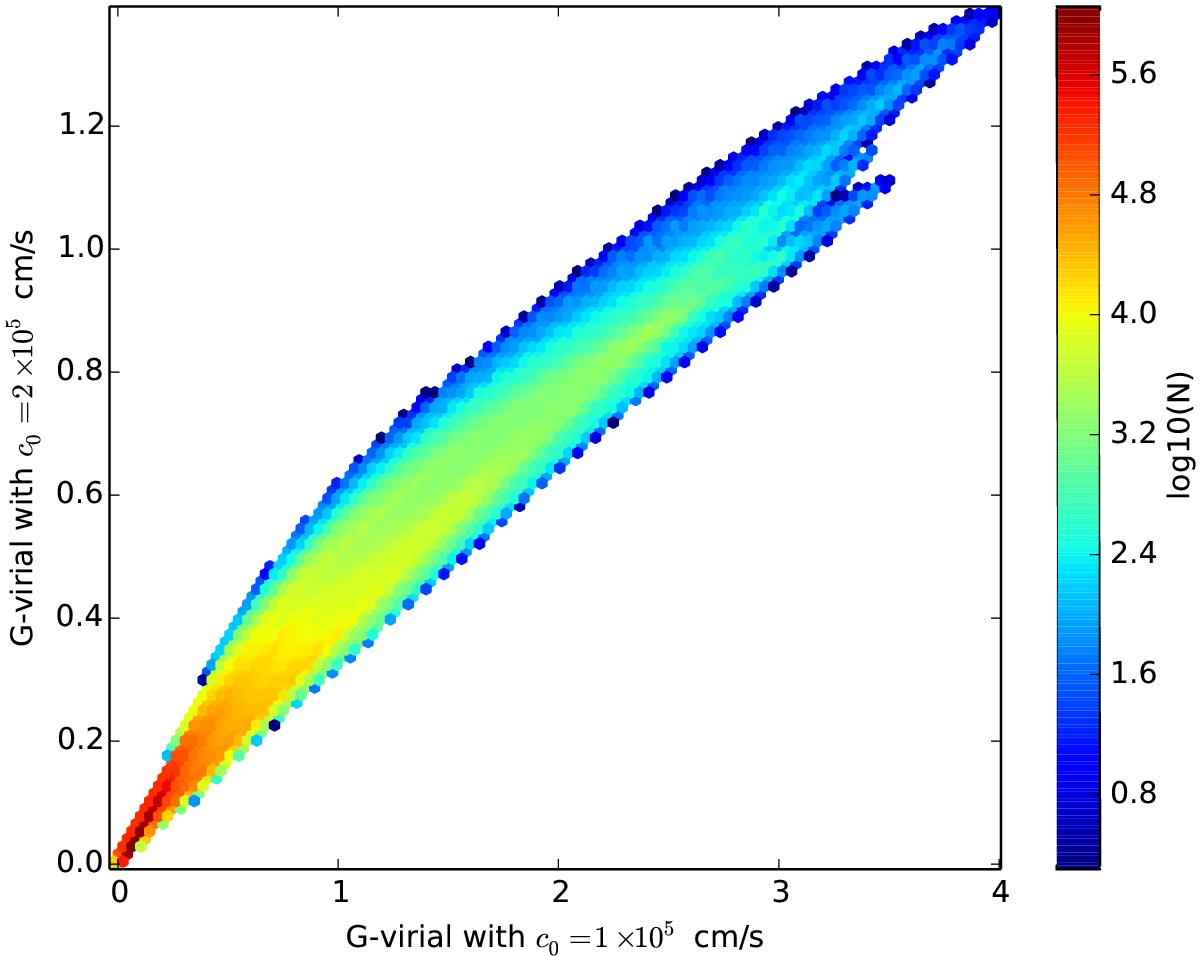
Comparison of G-virial map of the Ophiuchus molecular cloud under different c0. The horizontal axis is the G-virial calculated assuming c0 = 1 km s-1 and the vertical axis is the G-virial calculated assuming c0 = 2 km s-1. The grayscale image stands for the number of voxels that fall into each bin.
Current usage metrics show cumulative count of Article Views (full-text article views including HTML views, PDF and ePub downloads, according to the available data) and Abstracts Views on Vision4Press platform.
Data correspond to usage on the plateform after 2015. The current usage metrics is available 48-96 hours after online publication and is updated daily on week days.
Initial download of the metrics may take a while.