Fig. 2
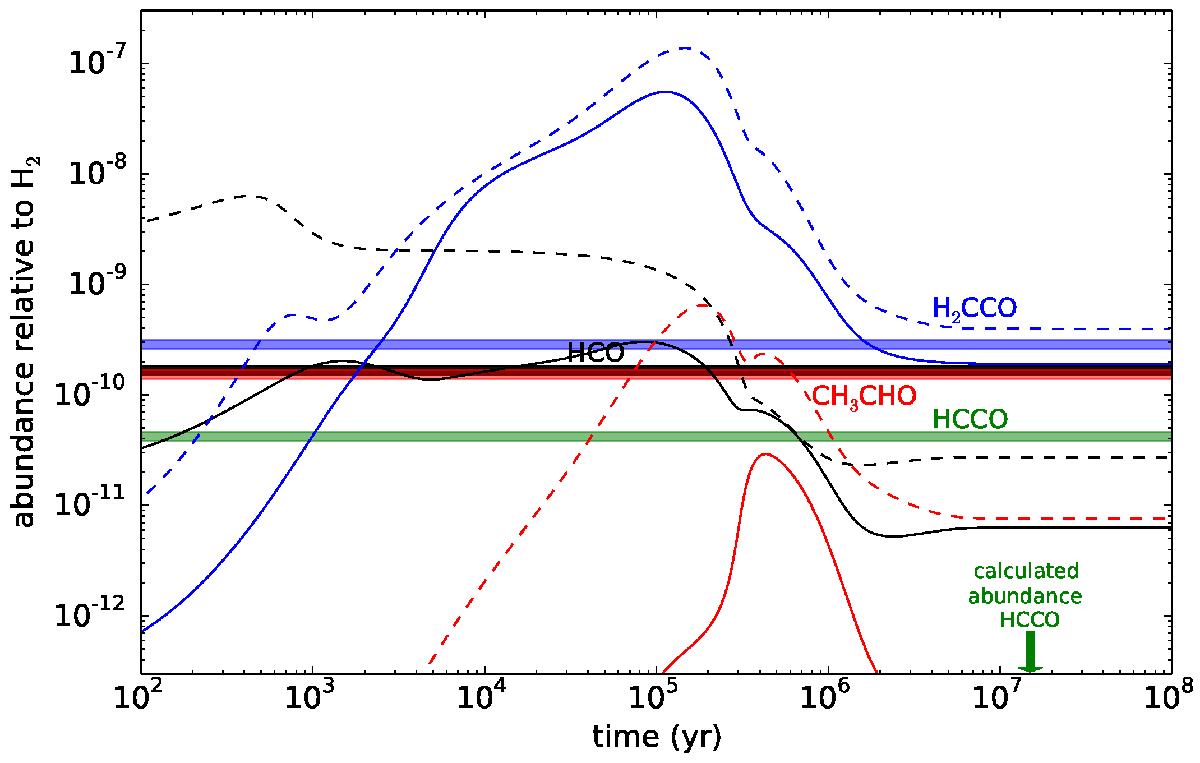
Calculated abundances as a function of time for a standard dark cloud model (parameters from Agúndez & Wakelam 2013). Solid lines use the KIDA kida.uva.2014 ratefile (Wakelam et al. 2015) and dashed lines the UMIST RATE12 ratefile (McElroy et al. 2013). In both cases a subset of reactions involving HCCO is introduced, although its calculated abundance remains below the range plotted. The horizontal thick lines indicate the observed abundances in Lupus-1A.
Current usage metrics show cumulative count of Article Views (full-text article views including HTML views, PDF and ePub downloads, according to the available data) and Abstracts Views on Vision4Press platform.
Data correspond to usage on the plateform after 2015. The current usage metrics is available 48-96 hours after online publication and is updated daily on week days.
Initial download of the metrics may take a while.