Free Access
Fig. C.2
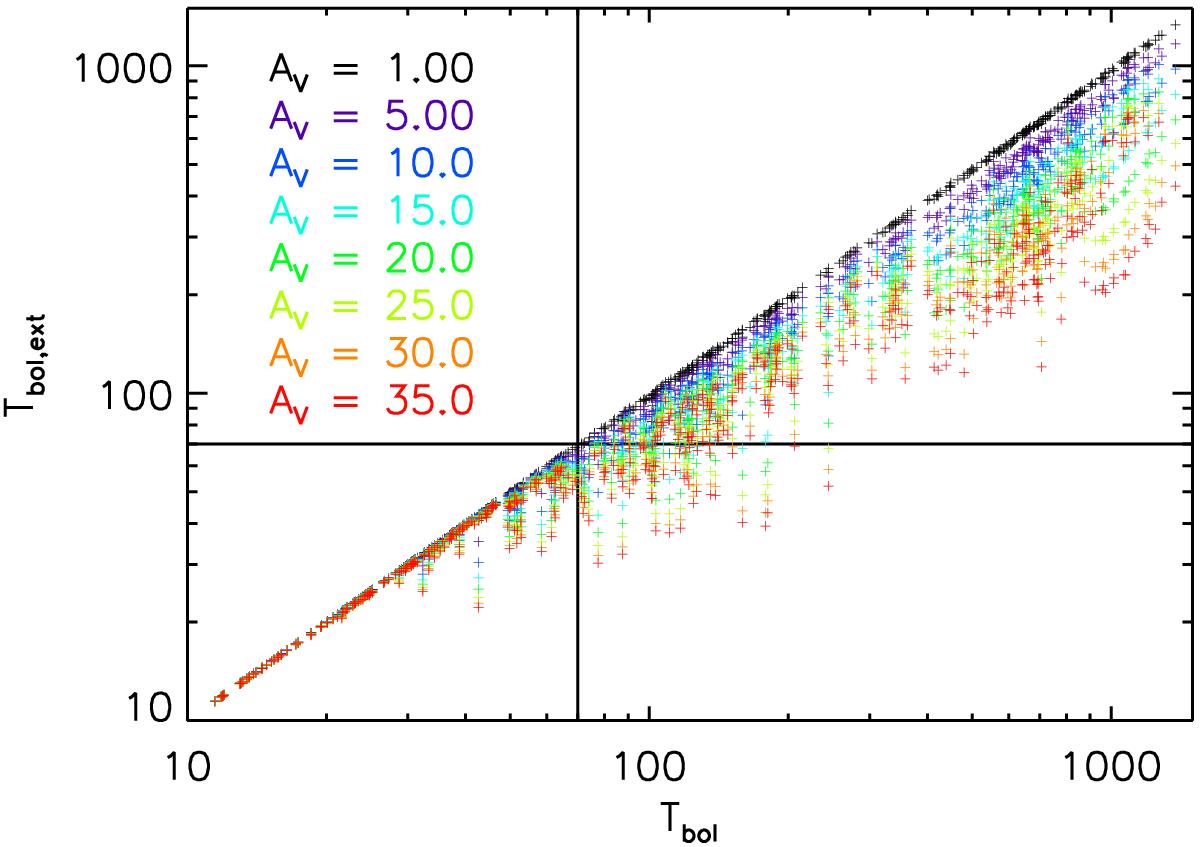
Model Tbol values versus extincted SED Tbol,ext values. Colors indicate the assumed levels of extinction. Here we show 500 randomly chosen models. As the extinction AV increases, the model Tbol,ext decreases and the levels of contamination at Tbol,ext< 70 K increases.
Current usage metrics show cumulative count of Article Views (full-text article views including HTML views, PDF and ePub downloads, according to the available data) and Abstracts Views on Vision4Press platform.
Data correspond to usage on the plateform after 2015. The current usage metrics is available 48-96 hours after online publication and is updated daily on week days.
Initial download of the metrics may take a while.