Fig. 3
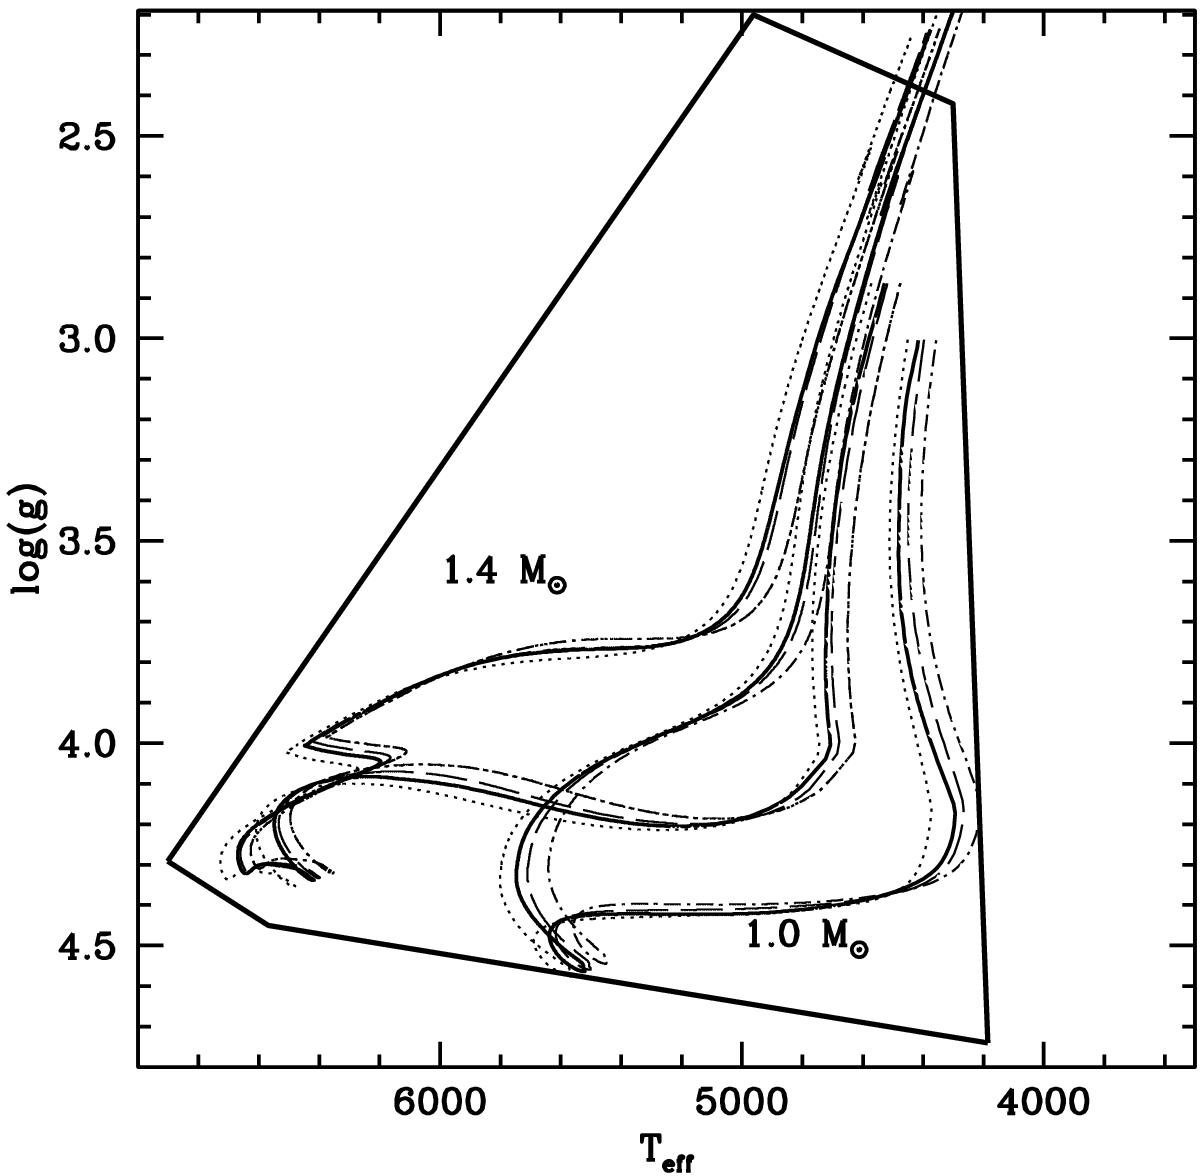
As the upper panel of Fig. 1 but for evolutionary tracks with masses equal to 1.0 and 1.4 M⊙, respectively. Thick solid lines denote fully consistent calculations with the RHD calibrated variable αml and T(τ) relationships. Dotted, dash-dotted, and dashed lines display tracks calculated with constant αml, ⊙ and the Eddington, KS, and VALcT(τ), respectively.
Current usage metrics show cumulative count of Article Views (full-text article views including HTML views, PDF and ePub downloads, according to the available data) and Abstracts Views on Vision4Press platform.
Data correspond to usage on the plateform after 2015. The current usage metrics is available 48-96 hours after online publication and is updated daily on week days.
Initial download of the metrics may take a while.