Fig. 1
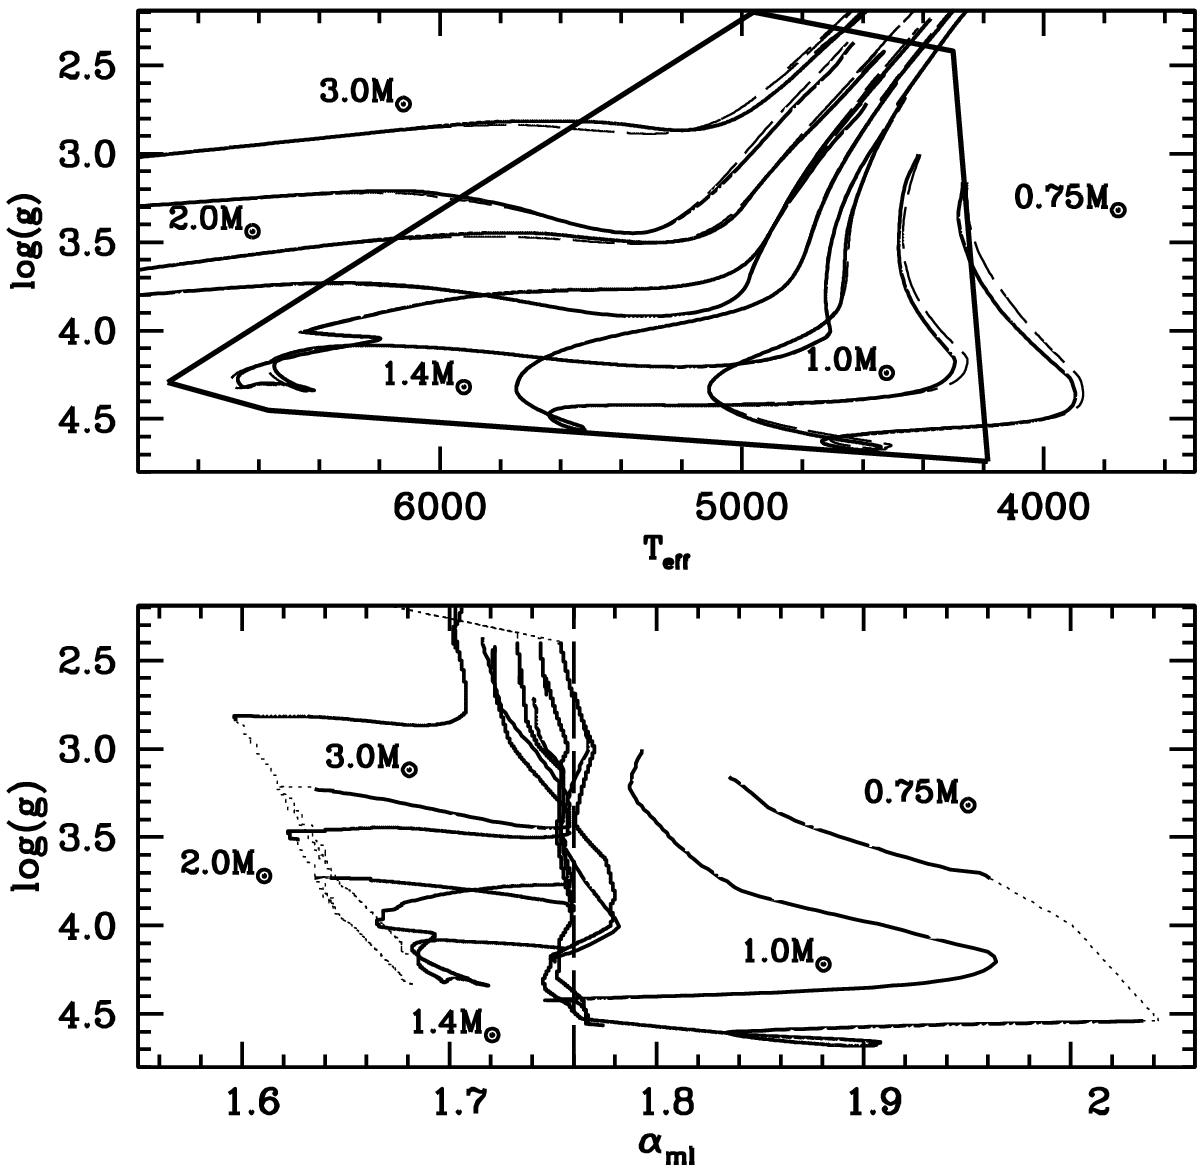
Stellar evolution tracks in the g − Teff diagram for the labelled masses. The region enclosed by the thick black boundary is the g − Teff range covered by the RHD simulations. Thick solid lines denote fully consistent calculations with the RHD calibrated variable αml and T(τ) relationships. The lower panel displays the evolution of αml along each track. The dotted portion of each sequence denotes the region where the αml values are extrapolated. Dashed lines in the upper panel represent tracks calculated with a constant αml = αml, ⊙ and the RHD T(τ) relationships.
Current usage metrics show cumulative count of Article Views (full-text article views including HTML views, PDF and ePub downloads, according to the available data) and Abstracts Views on Vision4Press platform.
Data correspond to usage on the plateform after 2015. The current usage metrics is available 48-96 hours after online publication and is updated daily on week days.
Initial download of the metrics may take a while.