Fig. 8
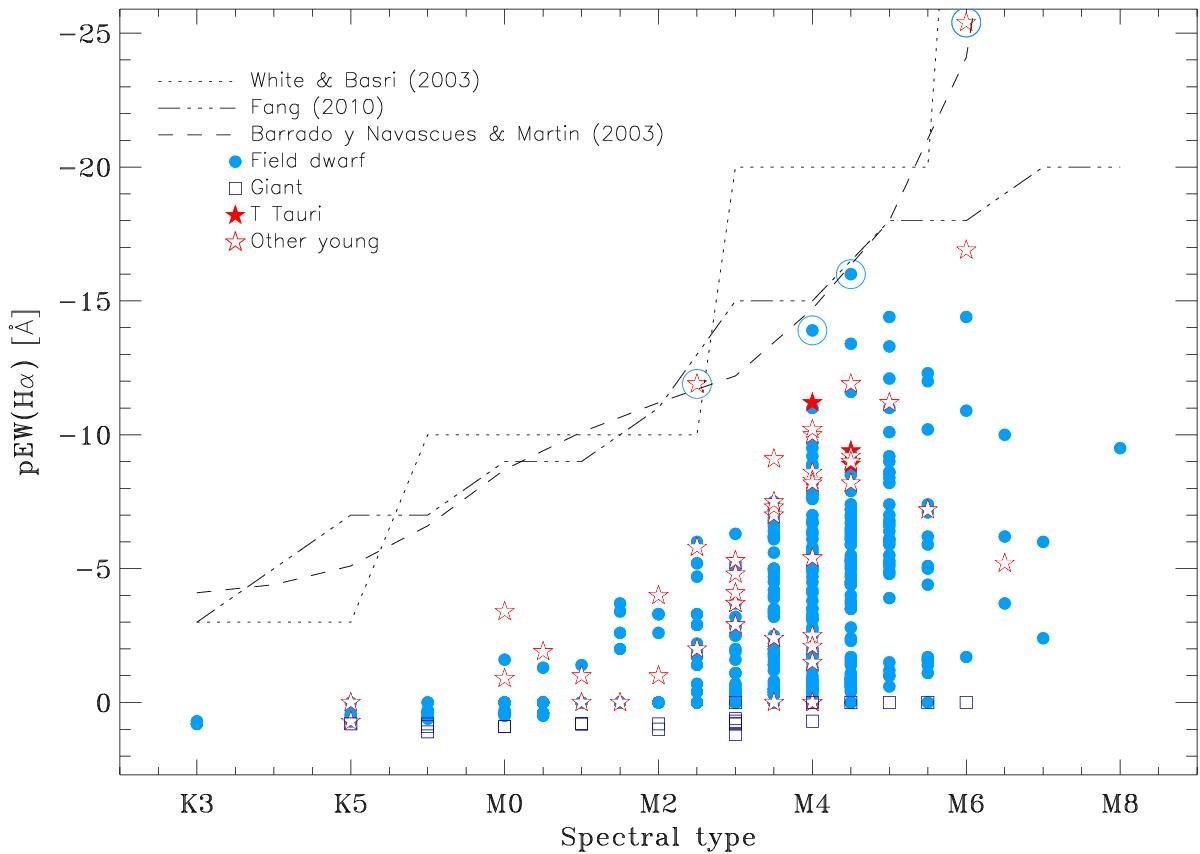
Pseudo-equivalent width of Hα line vs. spectral type diagram. Measurement errors are 0.5 subtypes for the spectral type and are of the order of 10% with a minimum of 0.1 Å for pEW(Hα) (but scatter due to variability is probably larger than 10%). Dotted, dash-dotted, and dashed lines indicate the boundaries between chromospheric and accretion emission for different authors. Giants, plotted with open squares, have filled Hα lines or in absorption. None of the young stars, plotted with open and filled stars, show accretion emission. The four stars at the accretion boundary discussed in the text are encircled.
Current usage metrics show cumulative count of Article Views (full-text article views including HTML views, PDF and ePub downloads, according to the available data) and Abstracts Views on Vision4Press platform.
Data correspond to usage on the plateform after 2015. The current usage metrics is available 48-96 hours after online publication and is updated daily on week days.
Initial download of the metrics may take a while.