Free Access
Fig. 7
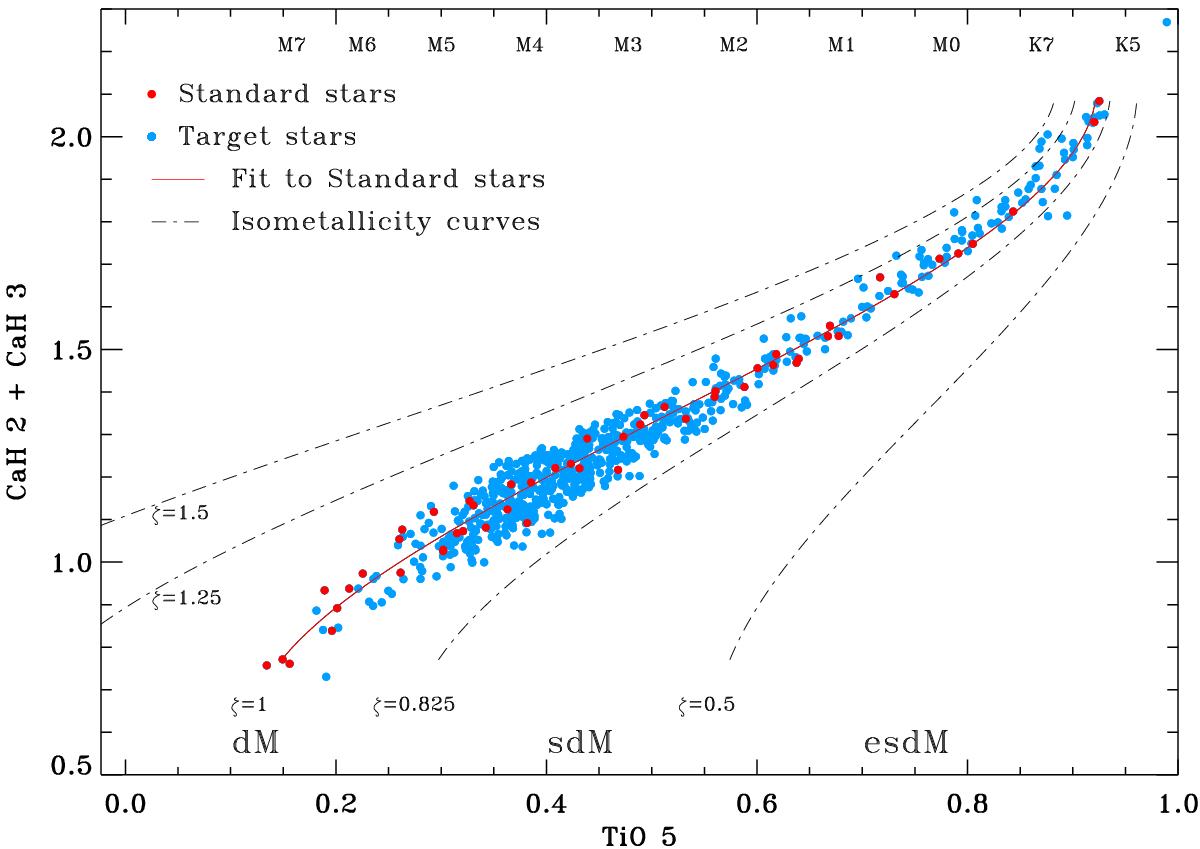
CaH 2 + CaH 3 vs. TIO 5 index-index diagram of our CAFOS stars, after discarding giants. The spectral types at the top are indicative, but follow the TiO 5 fit given in Table 5. The solid and dash-dotted lines are iso-metallicity curves of the ζ index.
Current usage metrics show cumulative count of Article Views (full-text article views including HTML views, PDF and ePub downloads, according to the available data) and Abstracts Views on Vision4Press platform.
Data correspond to usage on the plateform after 2015. The current usage metrics is available 48-96 hours after online publication and is updated daily on week days.
Initial download of the metrics may take a while.