Fig. 6
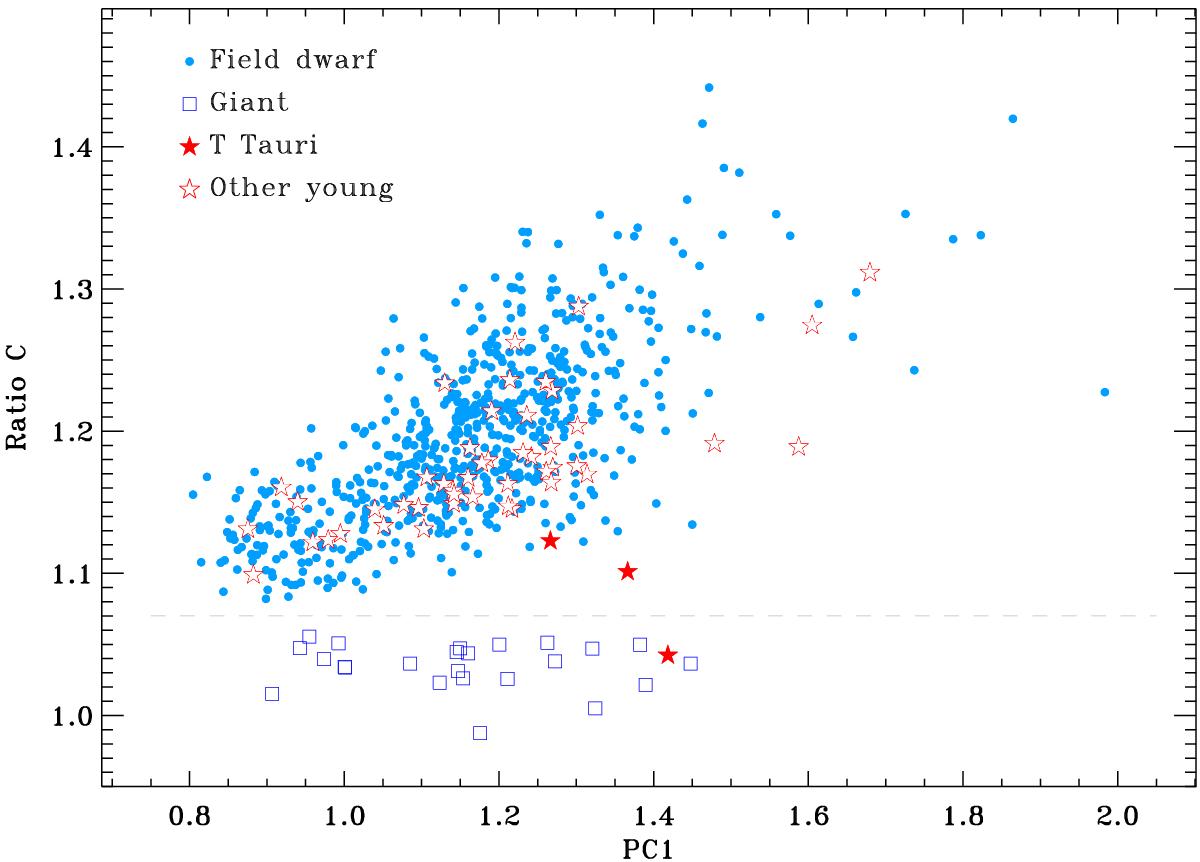
Ratio C vs. PC1 index-index diagram. The different symbols represent field dwarfs (small dots, blue), giants (open squares, dark blue), Taurus stars (filled stars, red), and other young stars (open stars, red). All giants are below the dashed line at Ratio C = 1.07. The dashed line is the empirical border of the giant star region.
Current usage metrics show cumulative count of Article Views (full-text article views including HTML views, PDF and ePub downloads, according to the available data) and Abstracts Views on Vision4Press platform.
Data correspond to usage on the plateform after 2015. The current usage metrics is available 48-96 hours after online publication and is updated daily on week days.
Initial download of the metrics may take a while.