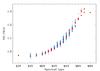
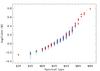
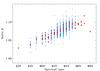
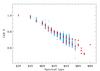
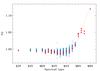
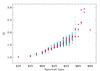
Fig. 4
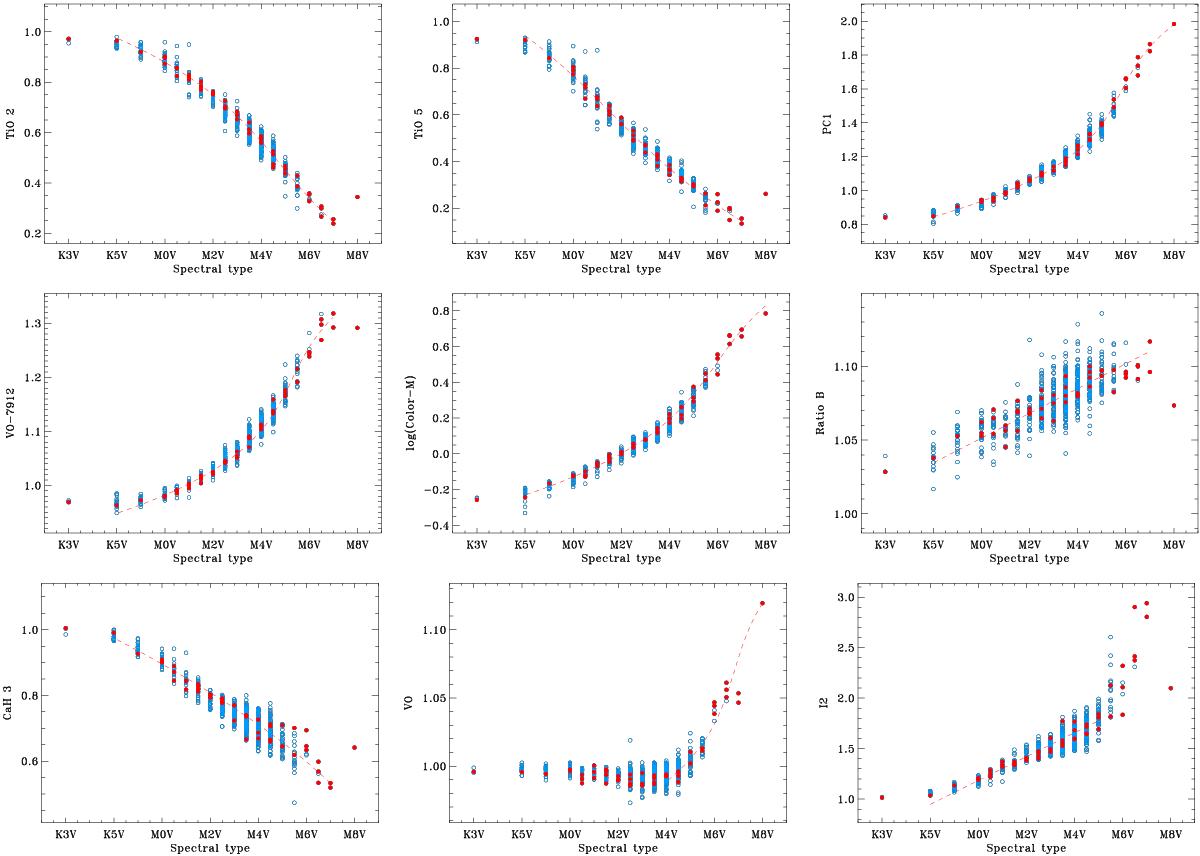
Nine representative spectral indices as a function of spectral type. Filled (red) circles: standard stars. Open (blue) circles: remaining target stars. Dashed (red) line: fit to straight line, parabola, or cubic polynomial, drawn only in the range of application of the fit. Top left and middle: TiO 2 and TiO 5 (Reid et al. 1995), with negative slopes and useable up to M7 V; top right: PC1 (Martín et al. 1996), a monotonous spectral indicator from K5 V to M8 V; centre left and middle: VO-7912 (Martín et al. 1999) and Color-M (Lépine et al. 2003), two indices very similar to the PC1. Note the logarithmic scale in Color-M; centre right: ratio B (Kirkpatrick et al. 1991), sensitive to several stellar parameters and, thus, with a large scatter in the spectral type relation; bottom left: CaH 3 (Reid et al. 1995), with a slightly larger scatter than pseudo-continuum or titanium oxide indices, due to metallicity; bottom middle: VO (Kirkpatrick et al. 1995), useable only for determining spectral types later than M4 V; bottom right: I2 (Martín & Kun 1996), with a linear range of variation from mid-K to mid-M and a sudden increase (or high dispersion) at late-M.
Current usage metrics show cumulative count of Article Views (full-text article views including HTML views, PDF and ePub downloads, according to the available data) and Abstracts Views on Vision4Press platform.
Data correspond to usage on the plateform after 2015. The current usage metrics is available 48-96 hours after online publication and is updated daily on week days.
Initial download of the metrics may take a while.