Fig. 6
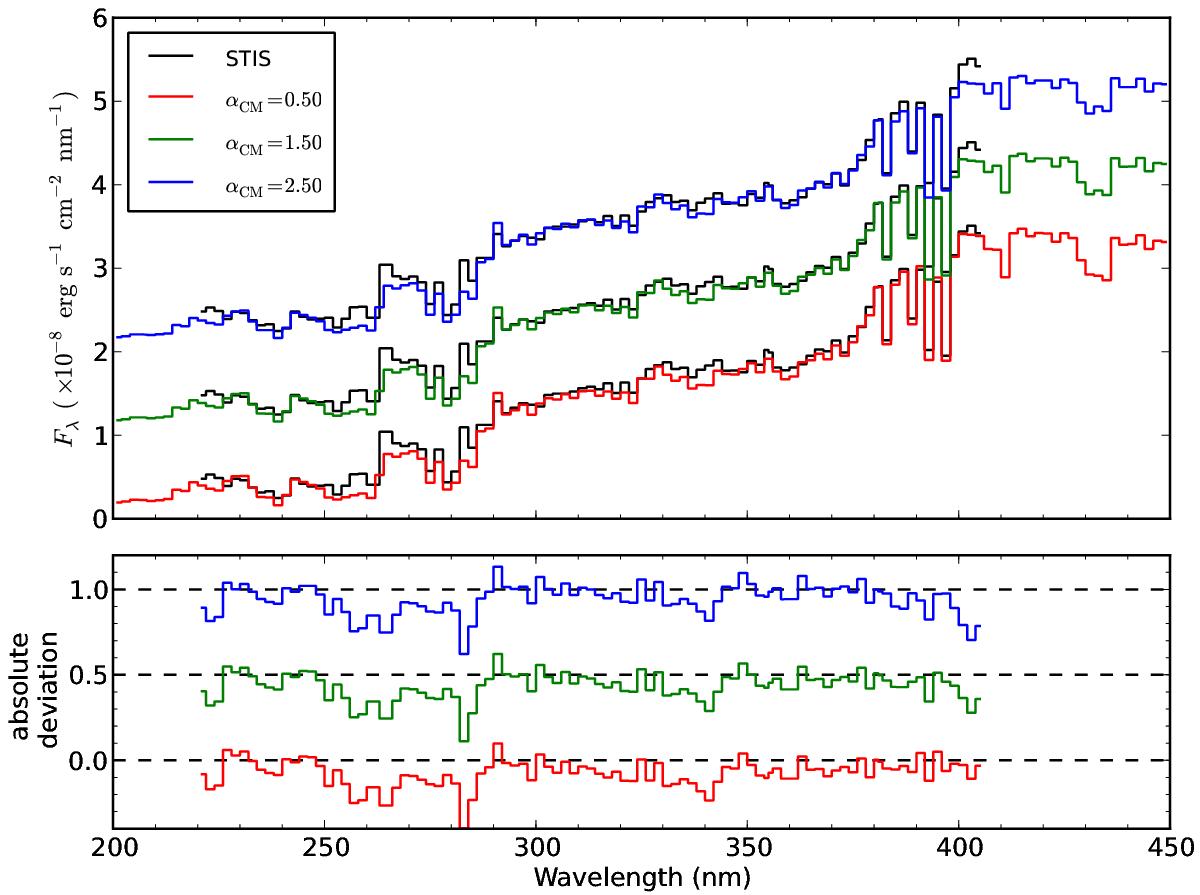
Comparison of absolute fluxes of Procyon A (solid lines) obtained with HST/STIS with MAFAGS-OS model fluxes with αCMA = 0.5 (red), 1.5 (green), and 2.5 (blue) in model (a). The fluxes were summed every 2 nm. The absolute deviation (Fmodel − Fobs) were plotted in the lower panel. Offsets of 1.0 in the upper panel and 0.5 in the lower panel were added for clarity.
Current usage metrics show cumulative count of Article Views (full-text article views including HTML views, PDF and ePub downloads, according to the available data) and Abstracts Views on Vision4Press platform.
Data correspond to usage on the plateform after 2015. The current usage metrics is available 48-96 hours after online publication and is updated daily on week days.
Initial download of the metrics may take a while.