Free Access
Fig. 12
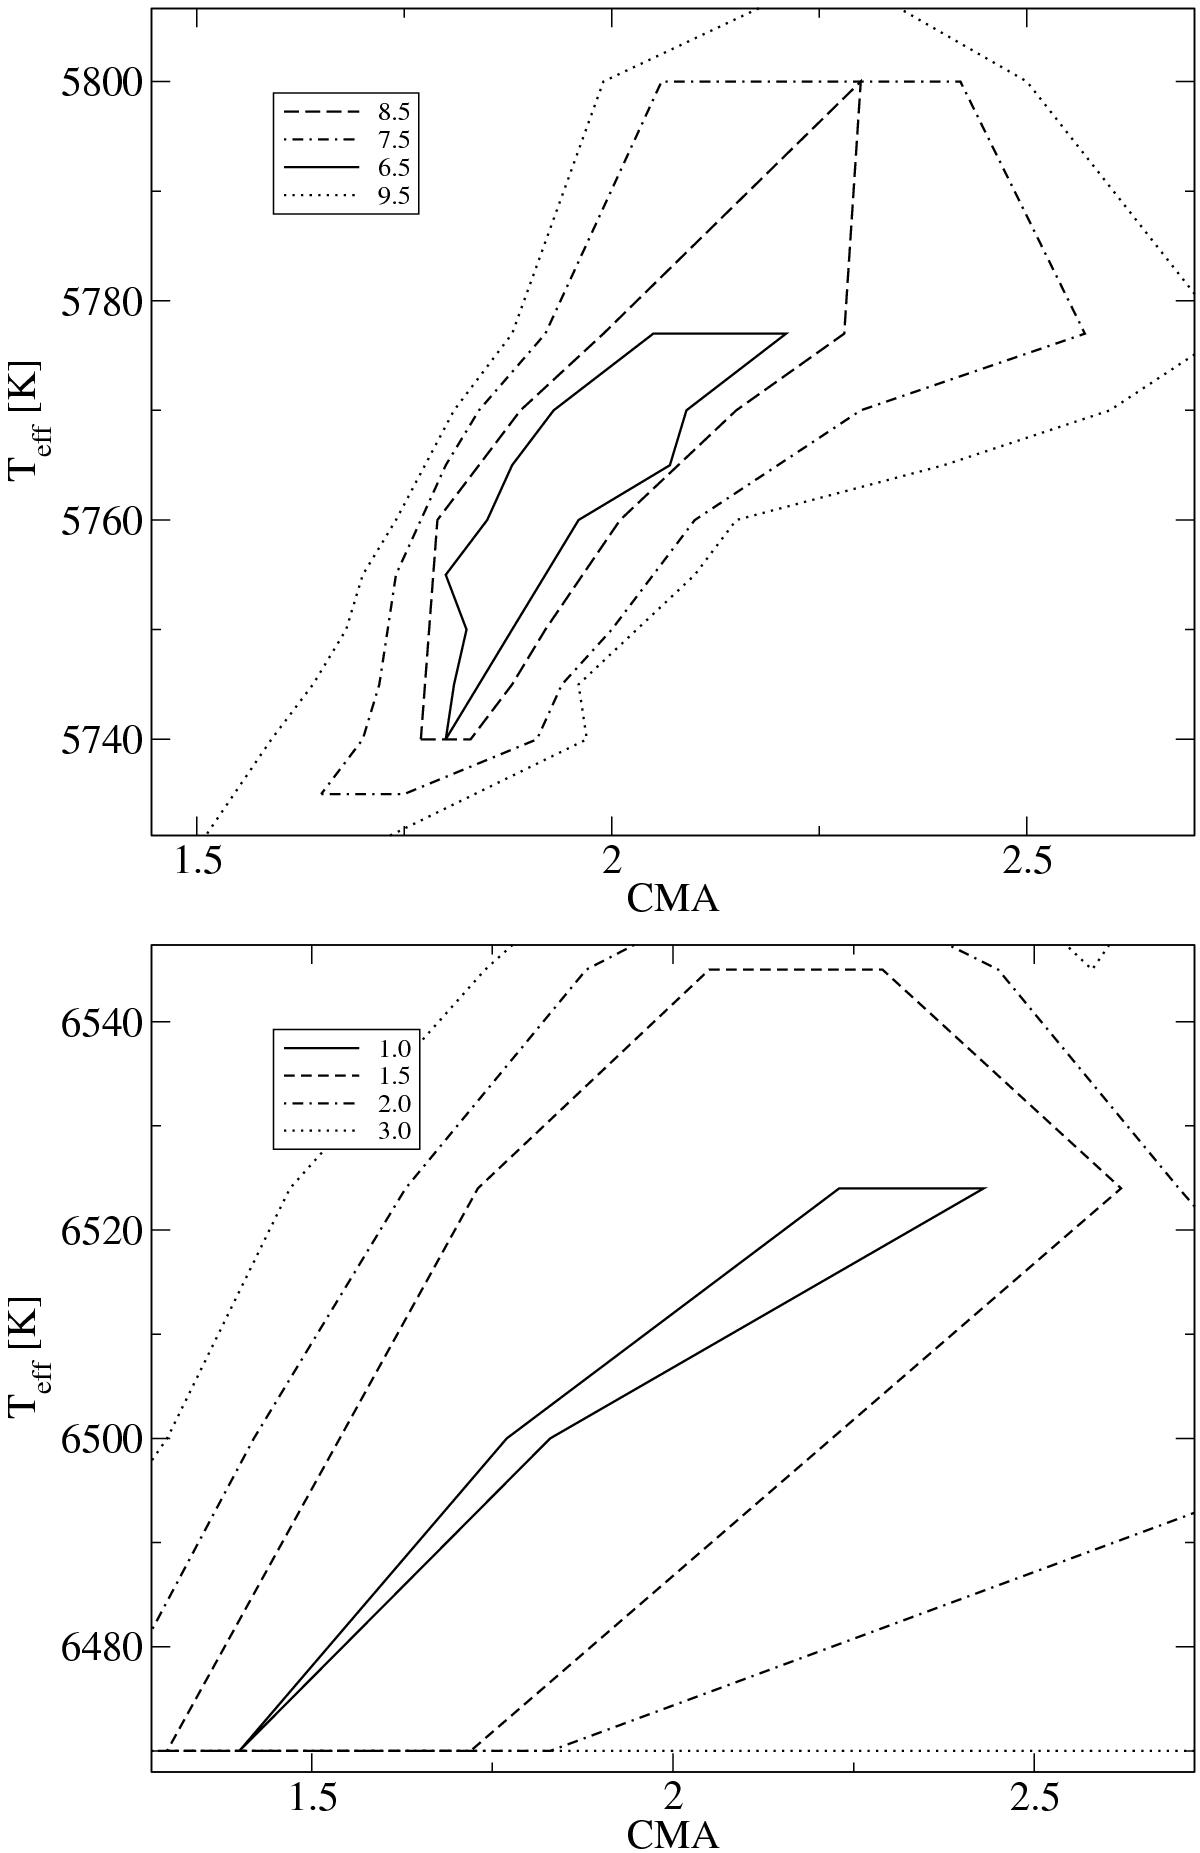
Survey of the reduced χ2 obtained from Hα profile fitting for the observed solar flux spectra (top panel) and spectra of Procyon (bottom panel) with different αCMA and Teff. The preferred parameter area is located where χ2 is minimal. All χ2 are not normalized and indicate a good fit in each case.
This figure is made of several images, please see below:
Current usage metrics show cumulative count of Article Views (full-text article views including HTML views, PDF and ePub downloads, according to the available data) and Abstracts Views on Vision4Press platform.
Data correspond to usage on the plateform after 2015. The current usage metrics is available 48-96 hours after online publication and is updated daily on week days.
Initial download of the metrics may take a while.