Fig. 11
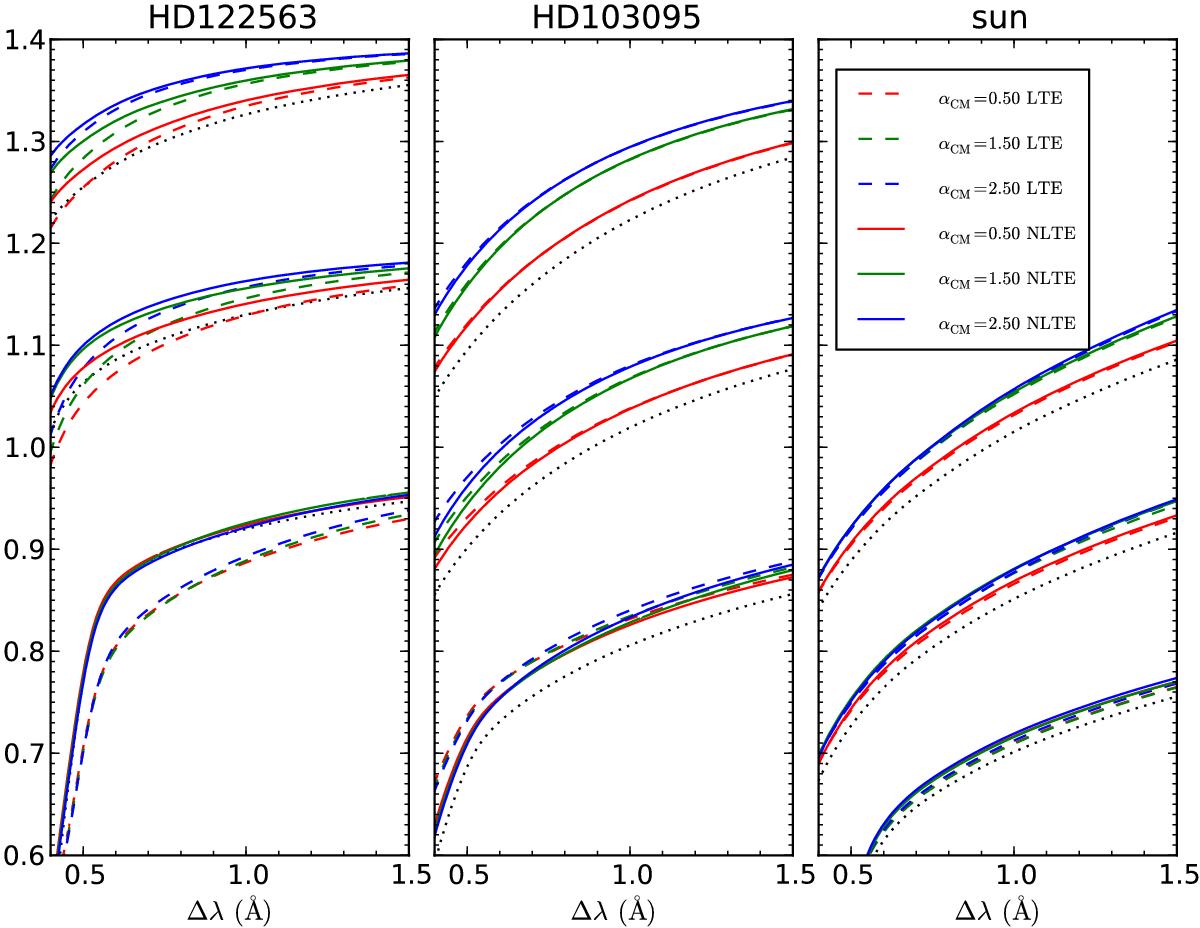
Comparison of the line profiles of Hα, Hβ, and Hγ (from bottom to top) for HD 122563, HD 103095, and the Sun. The x-axis is the wavelength shift relative to the center of the Balmer lines. The colors are coded with different αCMA (from 0.5 to 1.5), while the solid lines and dashed lines represent profiles using LTE and NLTE line formations, respectively. The dotted lines are profiles with LTE models of αCMA = 0.5 but Teff + 100 K. For clarity, offsets of 0.2 and 0.4 are added to the Hβ and Hγ, respectively.
Current usage metrics show cumulative count of Article Views (full-text article views including HTML views, PDF and ePub downloads, according to the available data) and Abstracts Views on Vision4Press platform.
Data correspond to usage on the plateform after 2015. The current usage metrics is available 48-96 hours after online publication and is updated daily on week days.
Initial download of the metrics may take a while.